MangaDex is bigger than you think. No, really.
People are often surprised (and/or sneer) at the complexity of some of the technical details we mention, but we do not engage in complexity for fun's sake. The site is simply unreasonably popular in comparison to our budget, and throwing money at our problems just isn't an option.
For reference, MangaDex v3 was at times in the top 1000 most popular websites worldwide. And v5, while still in open beta and missing a lot of features and polish, has already climbed back quite a bit within the top 10 000.
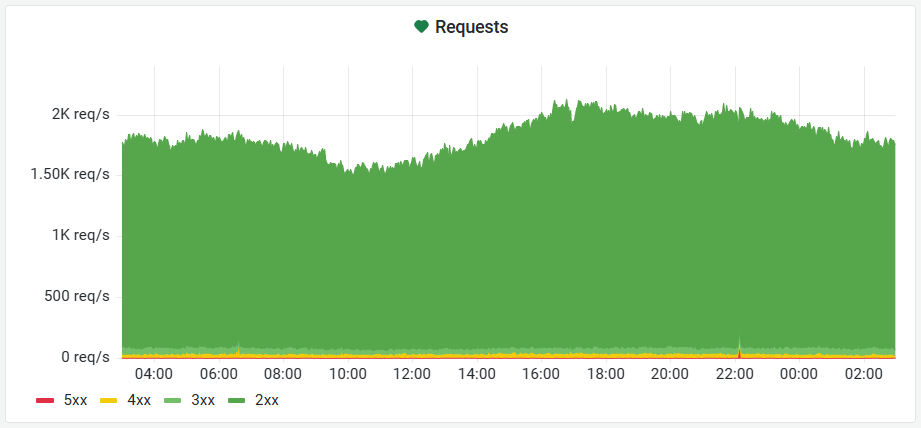
In practice, we currently see peaks of above 2000 requests every single second during prime time. That is multiple billions of requests per month, or more than 10 million unique monthly visitors. And all of this before actually serving images.
In comparison, our ~$1500/month budget would have many who run platforms at a similar scale laugh you out of the room, thinking that surely you forgot a zero. As such, MangaDex is past the point of things "just working" by chance, and requires a mix of creativity, research and experimentation to keep alive and especially to keep growing.
Now is also a good time to remind ourselves of what MangaDex is1.
It is a platform driven by and for the scanlation community on which anyone can read manga for free, ad-free and with absolutely no compromise on image quality.
Introduction
As we constantly fought to keep MangaDex v3 online and it went through a most painful end, one of the primary goals for the v5 rebuild was to ensure we could operate the platform in a secure and performant fashion in the future.
So, what do we refer to by "infrastructure"?
infrastructure, noun
The underlying foundation or basic framework [...] of a system or organization
~ Merriam Webster dictionary
Well, that is still quite vague. Here it will be used to denote the foundation upon which our applications lie.
In more concrete terms: having a database readily available, monitored and backed up for the backend to use would be infrastructure work, but what the backend actually uses it for (i.e.: end-user features) is out of scope and in the remit of the backend developers.
Where are we going?
I like to keep in mind an end-goal when embarking on a complex project over a long period of time. It might be far off, and we might have to take unexpected detours on our way to it, but it's a good guide when making important architectural decisions, and every step taken towards it is a win.
The following, in this order, are what we see as the most important features of our infrastructure: security by design, observability, reliability and scalability.
With this out of the way, let's discuss some of the aspects of our current systems.
Current state overview and limits
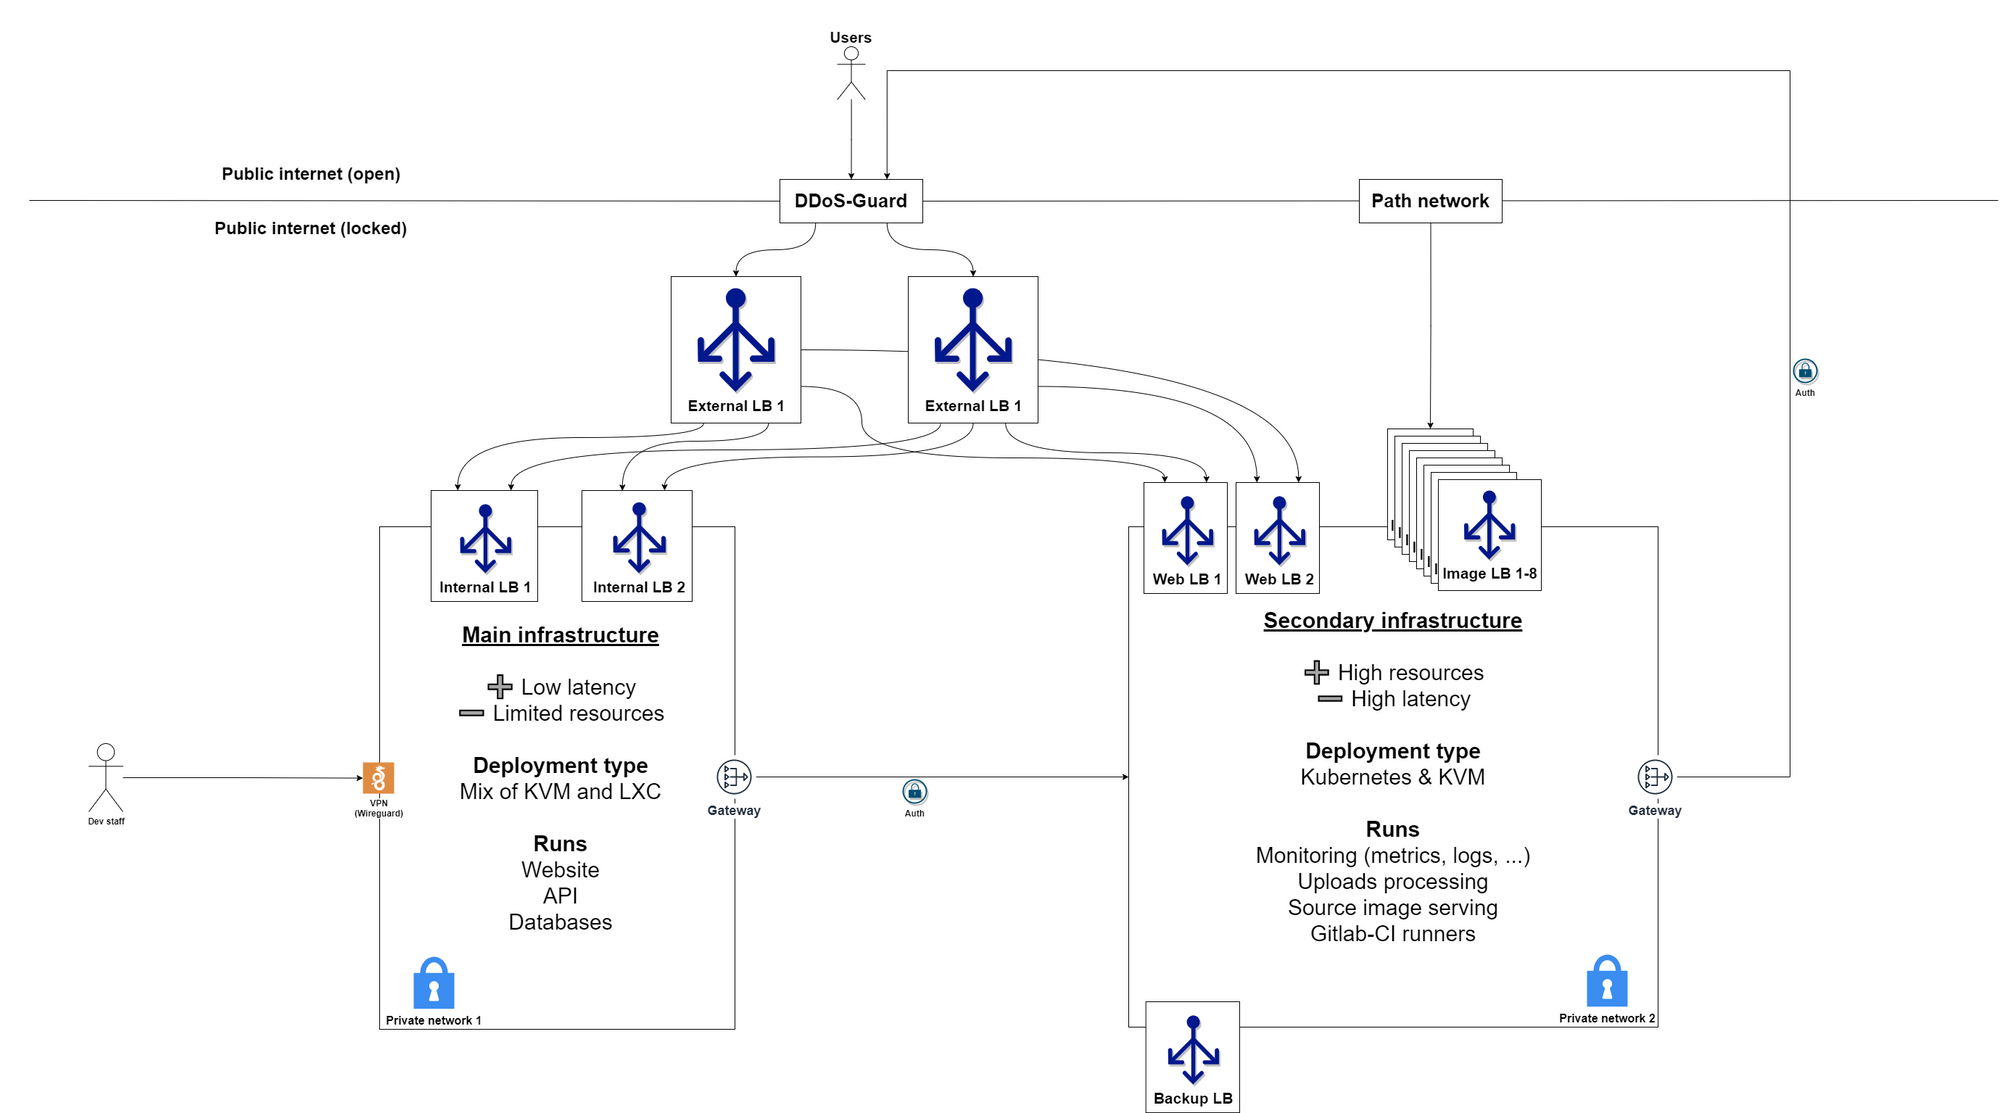
This is a high-level view of our current production network. The split in two main hubs is in good part due to us having access to infrastructure in two distinct geographic regions, and we can't really afford to be demanding as to where servers are located. We take good deals where we can and make the most of it.
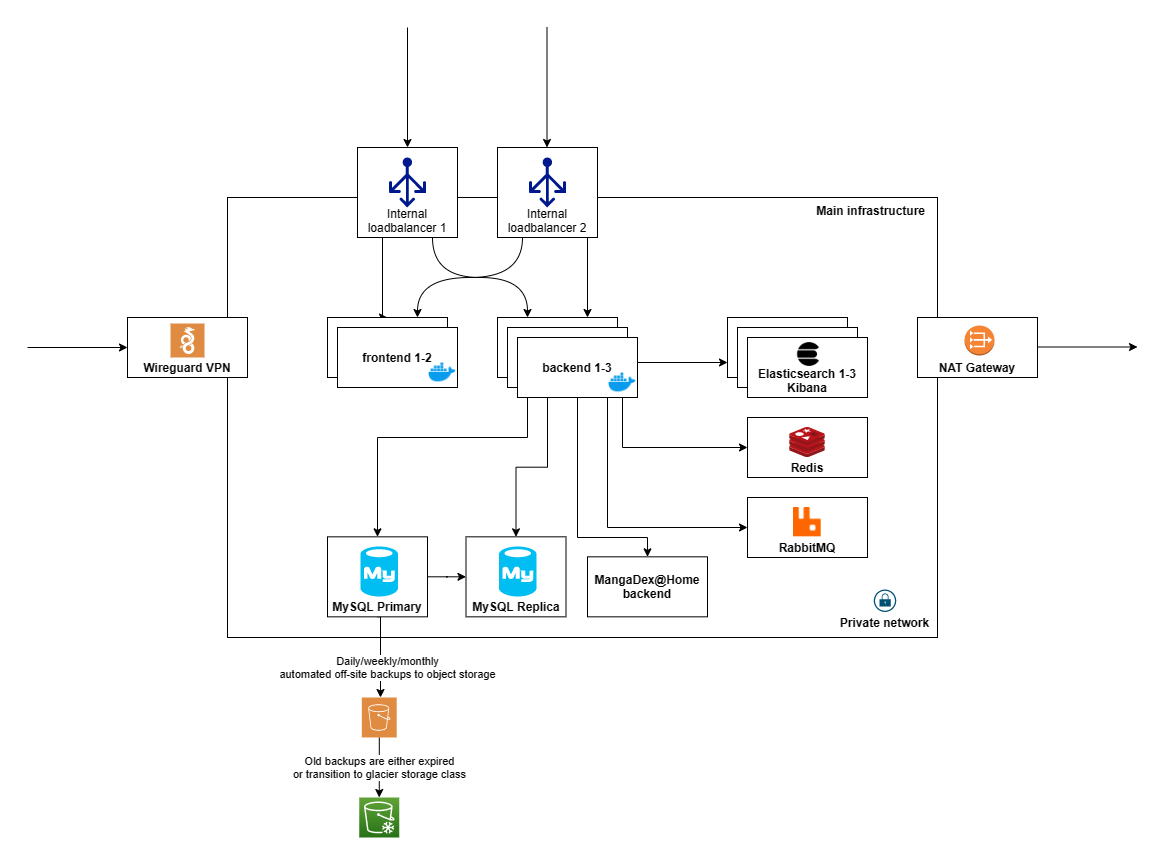
This is essentially a zoomed-in diagram of the left box in the network map. Access to the production VPN is also granted only to people who actively need it. The addition of a NAT gateway ensures that if somehow a public IP of ours leaked via some SSRF-like attack, we'd only need to swap a single address to affect all hosts. And to avoid misconceptions, no, we are not using AWS S3 as object storage, that would be far too costly. We do, however, use a commercial object storage service, as we still want absolute certainty for the safety of our backups.
Our development environment2 is essentially a carbon copy of this on a smaller scale (two backends instead of three – two Elasticsearch data-bearing nodes instead of three – and smaller everything in general). It does push its metrics/logs to the same monitoring infrastructure as the production servers but is otherwise completely unrelated (different providers, networks, databases...). While it is somewhat expensive to keep it similar enough to production, it grants us confidence to make large configuration changes when necessary. The only missing bit would be the ability to replicate production traffic, as some bugs only happen under very high traffic by a large number of concurrent users. This is however at best difficult or nearly impossible to do.
One major drawback of our current setup is that DDoS-Guard has (very) poor inter-region performance. Coupled with the naturally increased latency from being physically far from our servers (especially in Asia), this results in a very degraded end-user experience outside of Europe.
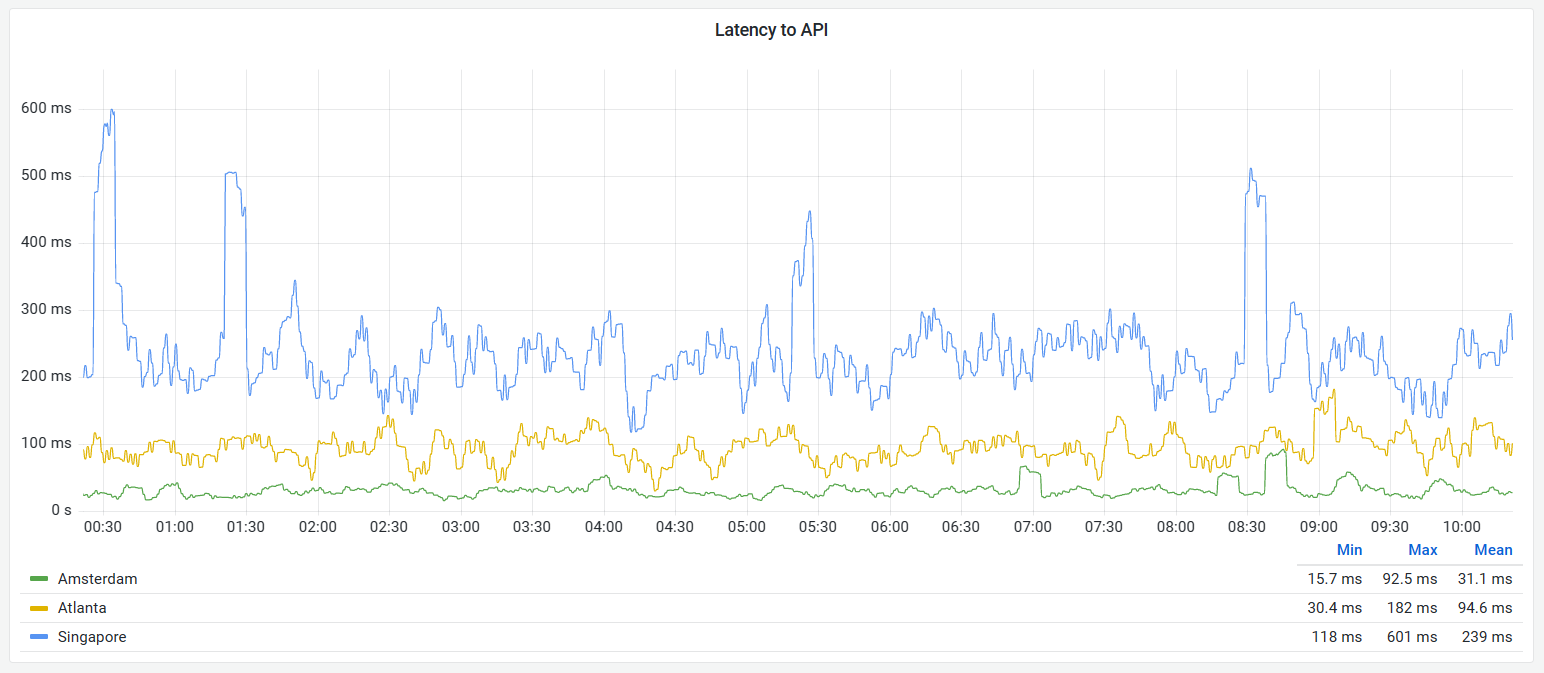
We continuously monitor the accessibility and responsiveness of the site across multiple major cities in the world, and taking Europe as a baseline we observe from three times the latency in North America to almost ten times the latency in Asia, with some pronounced spikes or straight up unreachability.
We have plans to remediate this, but that will not be trivial to achieve. The idea would be to have region-local read-only mirrors, and wire it all up at an inter-region level using one of Consul or Istio to make secure, discrete service meshes across the globe and still prevent any lateral movement capacity to a potential intruder. Something like Varnish + Backend + MySQL/ES read replicas would go a long way towards speeding things up for our distant users.
It isn't clear yet at this point which of these would be most fit for purpose however. Since we use a couple of HashiCorp products already (Terraform for our development environment provisioning and Vault for secrets management in general), it would be nice if Consul did the trick and we could leverage their integrations.
However, Consul seems to assume more of a "hub" model when we would benefit from a more point-to-point type of system. There are some ways around this, notably forming a Kubernetes cluster per region with a CNI like Kilo which establishes a peer-to-peer network over Wireguard tunnels.
Much still needs to be tested for that last point to become reality, but hopefully it isn't too far away.
Deployment overview
Currently, our deployment environments come in two types: bare VMs and Kubernetes clusters.
The VMs are generally based on KVM or LXC. The rule of thumb is that if it is exposed publicly we are using KVM, otherwise wherever possible we use LXC which is ever so slightly more flexible (but has some drawbacks due to non-total isolation from the host, like some shared sysctls values). The VMs are managed using the excellent Proxmox, and then configured using Ansible.
We (somewhat reluctantly) default to Ubuntu Server 20.04 since CentOS 7 is starting to seriously show its age, and CentOS 8 is essentially stillborn at this point. In particular, we are watching Rocky Linux and Alma Linux closely, as they both aim to be CentOS's spiritual successor and hopefully become a strong operating system choice for us in the future, once they have gained more traction and have been battle-tested with some of our tools.
For Kubernetes clusters we use Ansible, specifically the Kubespray project's playbooks, which helps avoid most of the occasionally absurd defaults of Kubernetes (for example, the standard CoreDNS-only deployment is still nothing but a very bad joke, and I'd strongly recommend looking into node-local DNS caches for anyone operating it) and generally makes management of on-premise clusters a pleasant experience.
Monitoring overview
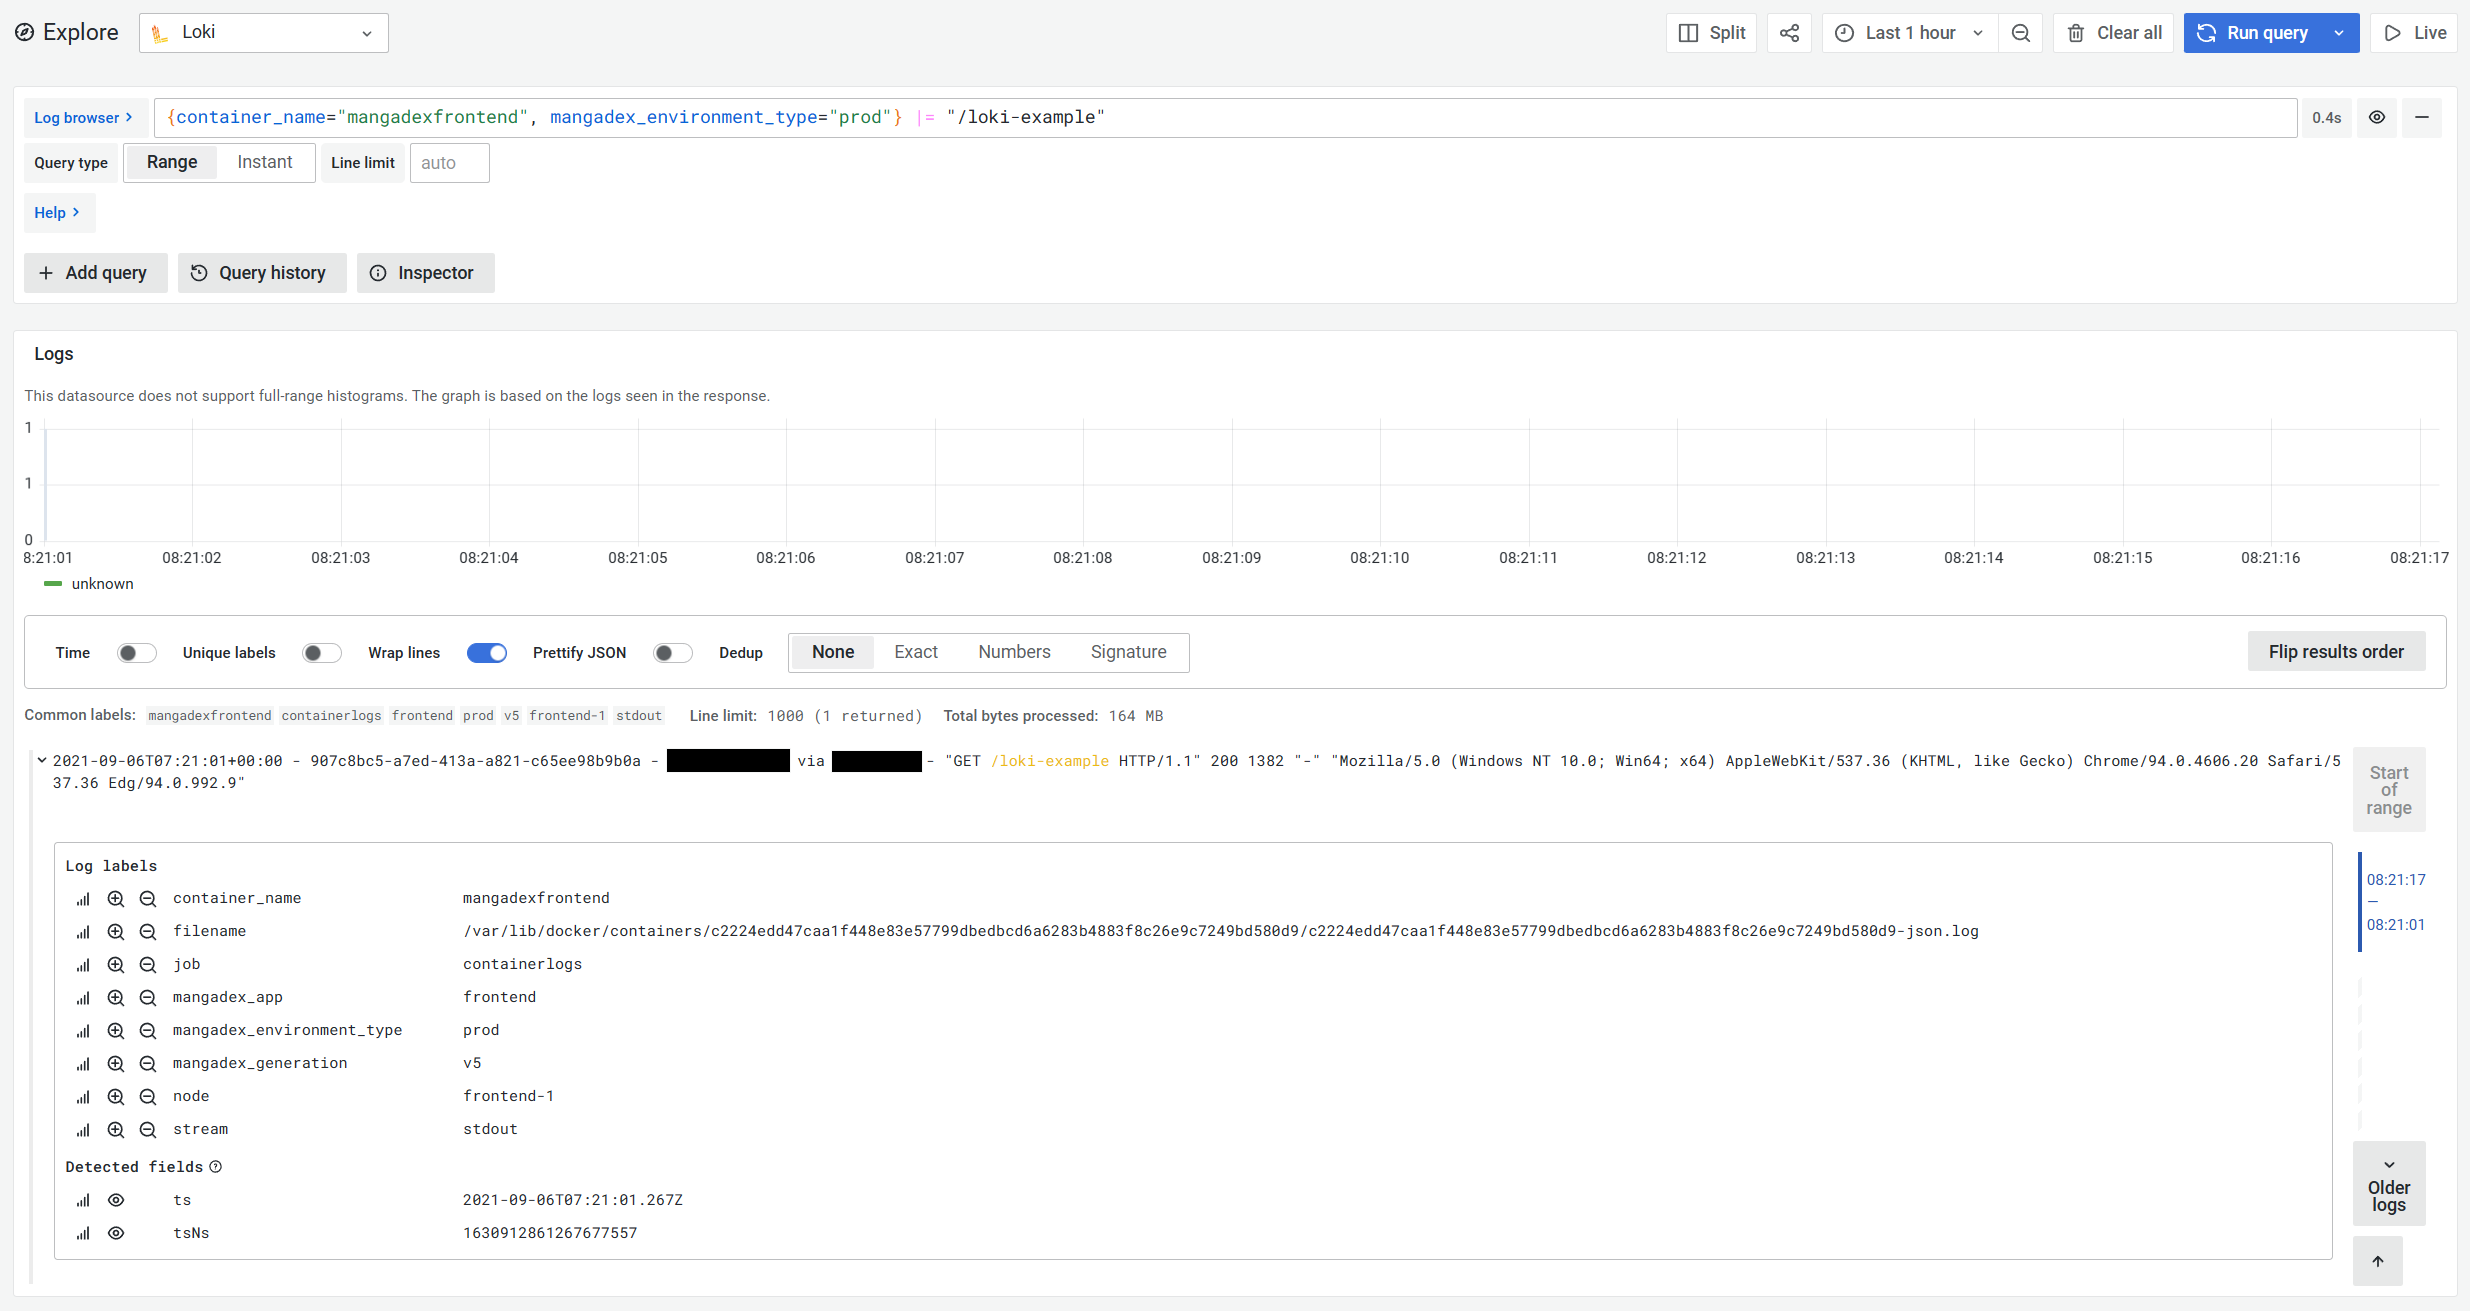
People familiar with it will have recognised the excellent Grafana in the screenshots shared within this article (I'm partial to its light theme, sorry!).
We have two main types of monitoring data to work with: metrics and logs. There are a plethora of SaaS options for these, all of which way too expensive for us, so we run them in-house as well. This is not ideal as it opens up the possibility of our monitoring being down alongside one of our environments, but money doesn't grow on trees after all.
With that said, we gather metrics by running a minimal Prometheus instance on every host3, with persistence disabled and configured to continuously ship metrics to a centralised Cortex instance using the remote write feature.
As for logs, we ship them using Promtail to a centralised Loki instance.
We then rely on Ceph's Object Gateway (sometimes called Rados Gateway) for persistent storage of this data. The template for how that all ties up together looks something like this:

Ceph
Ceph is probably one of the most impressive pieces of storage technology I have had the pleasure to work with over the past couple of years. It absolutely rips through almost all kinds of storage needs with some unreal performance for a network-attached storage system. Additionally, it can be consumed:
- as block devices at the kernel level (no need for FUSE horrors)
- as shared file system (think NFS but fast and near POSIX semantics)
- as an S3-compatible API
We make extensive use of all of these in various places and it really deserves its own article sometime later. For now, suffice to say that it's very understandable why it is one of the main storage technologies in use at CERN and many of the tech giants4.
More on this later, but I would warmly recommend it for scale-out storage purposes. Also, Proxmox has excellent native support for deploying and managing it on a cluster of servers, while Rook has a great operator for running it on Kubernetes node storage or PVCs.
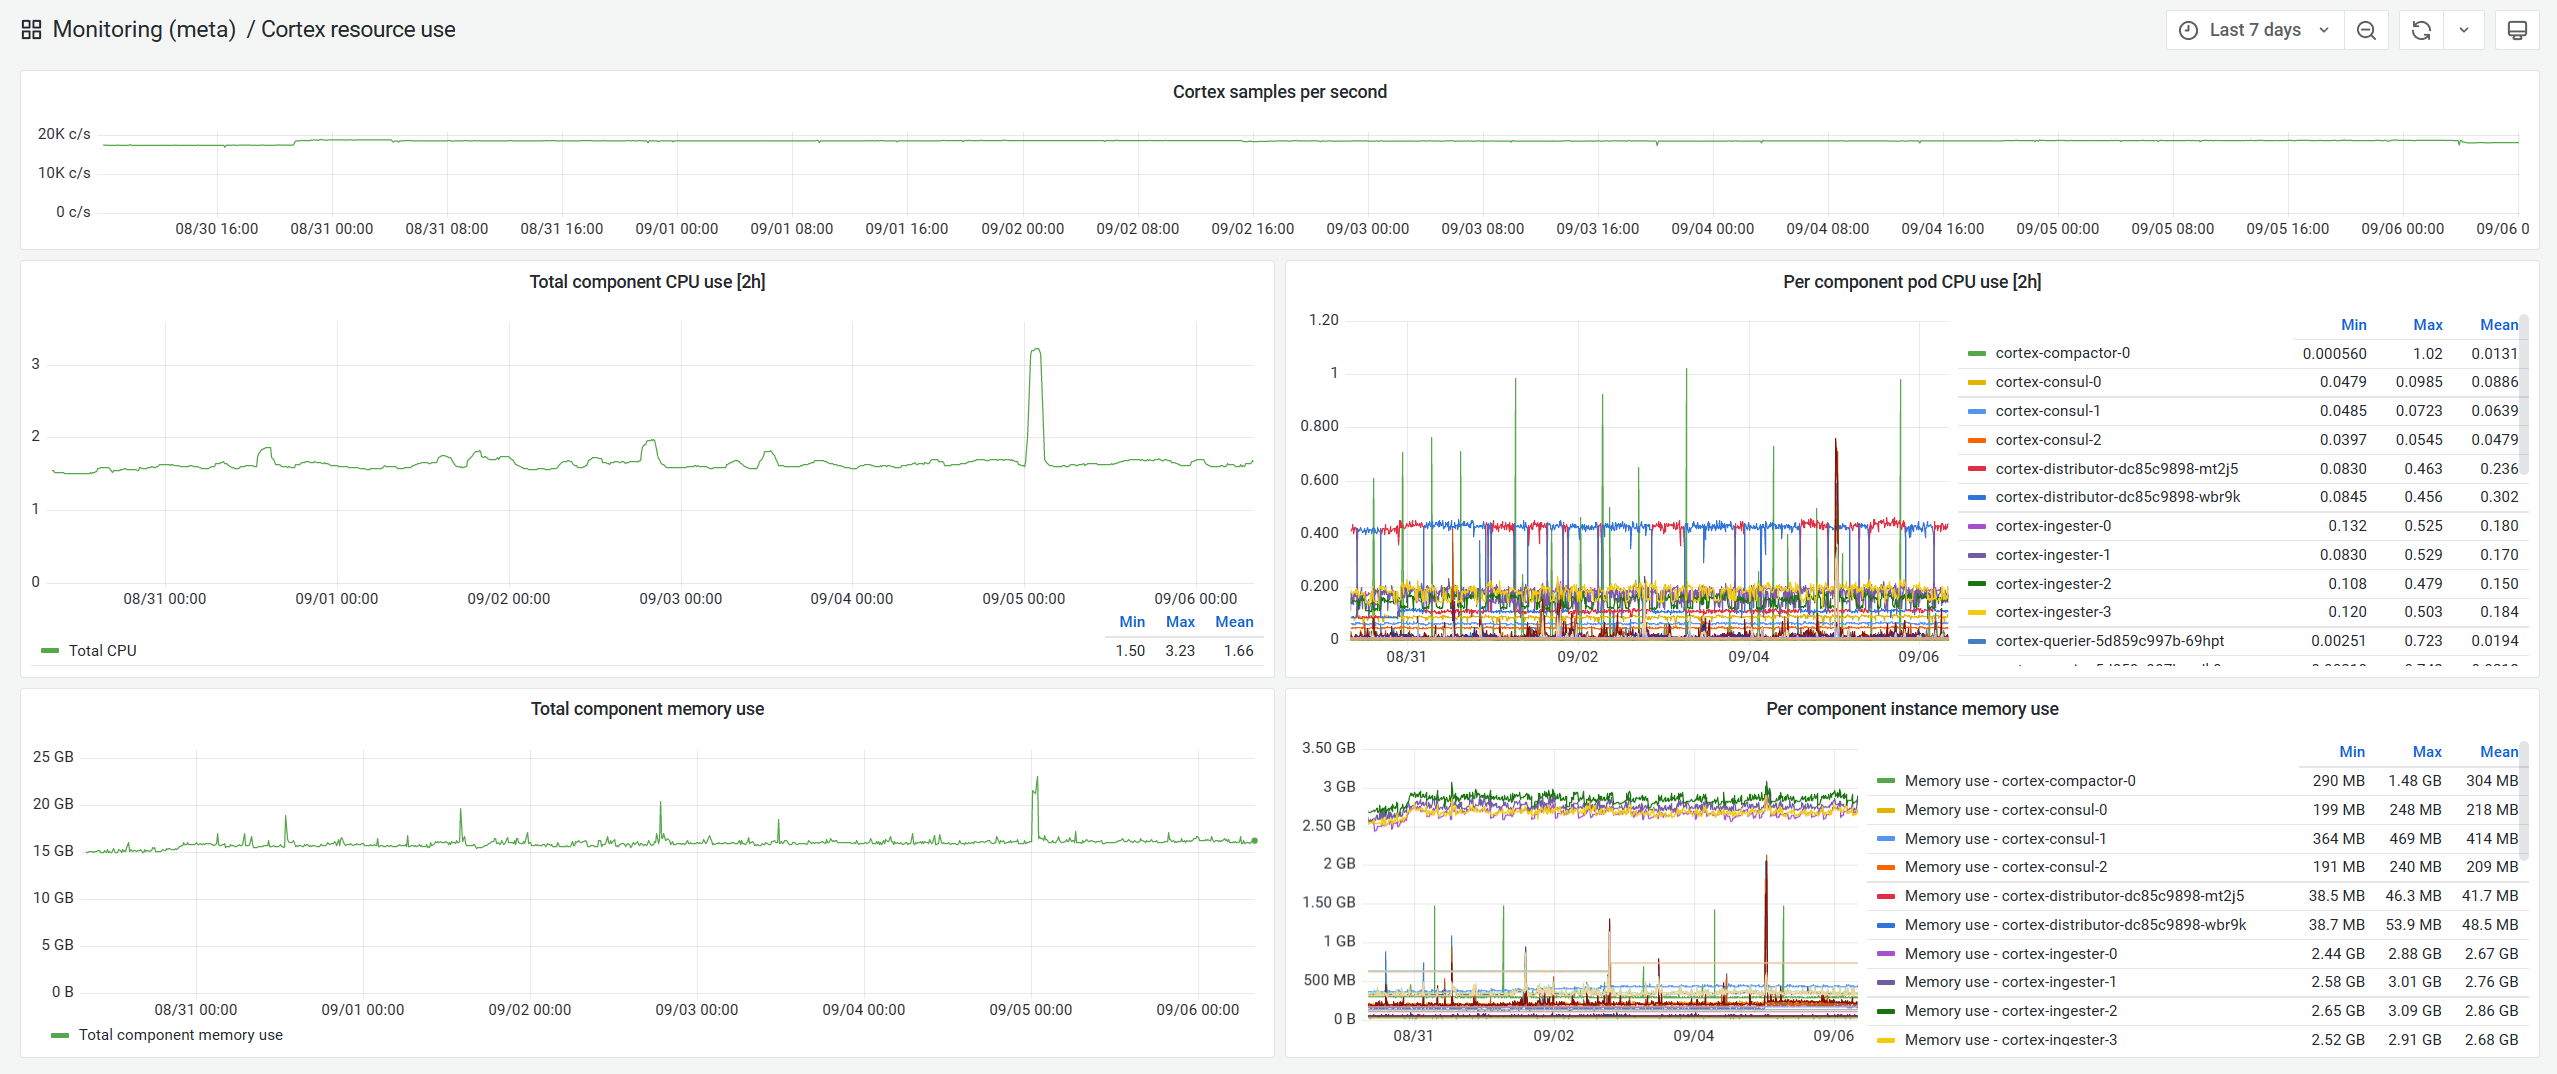
Metrics
As stated above, we collect metrics on every single host we manage, and ship them to a central Cortex cluster, which itself is deployed within Kubernetes. It acts as a horizontally scalable and exceptionally fast Prometheus-compatible system for long term storage and querying of metrics.
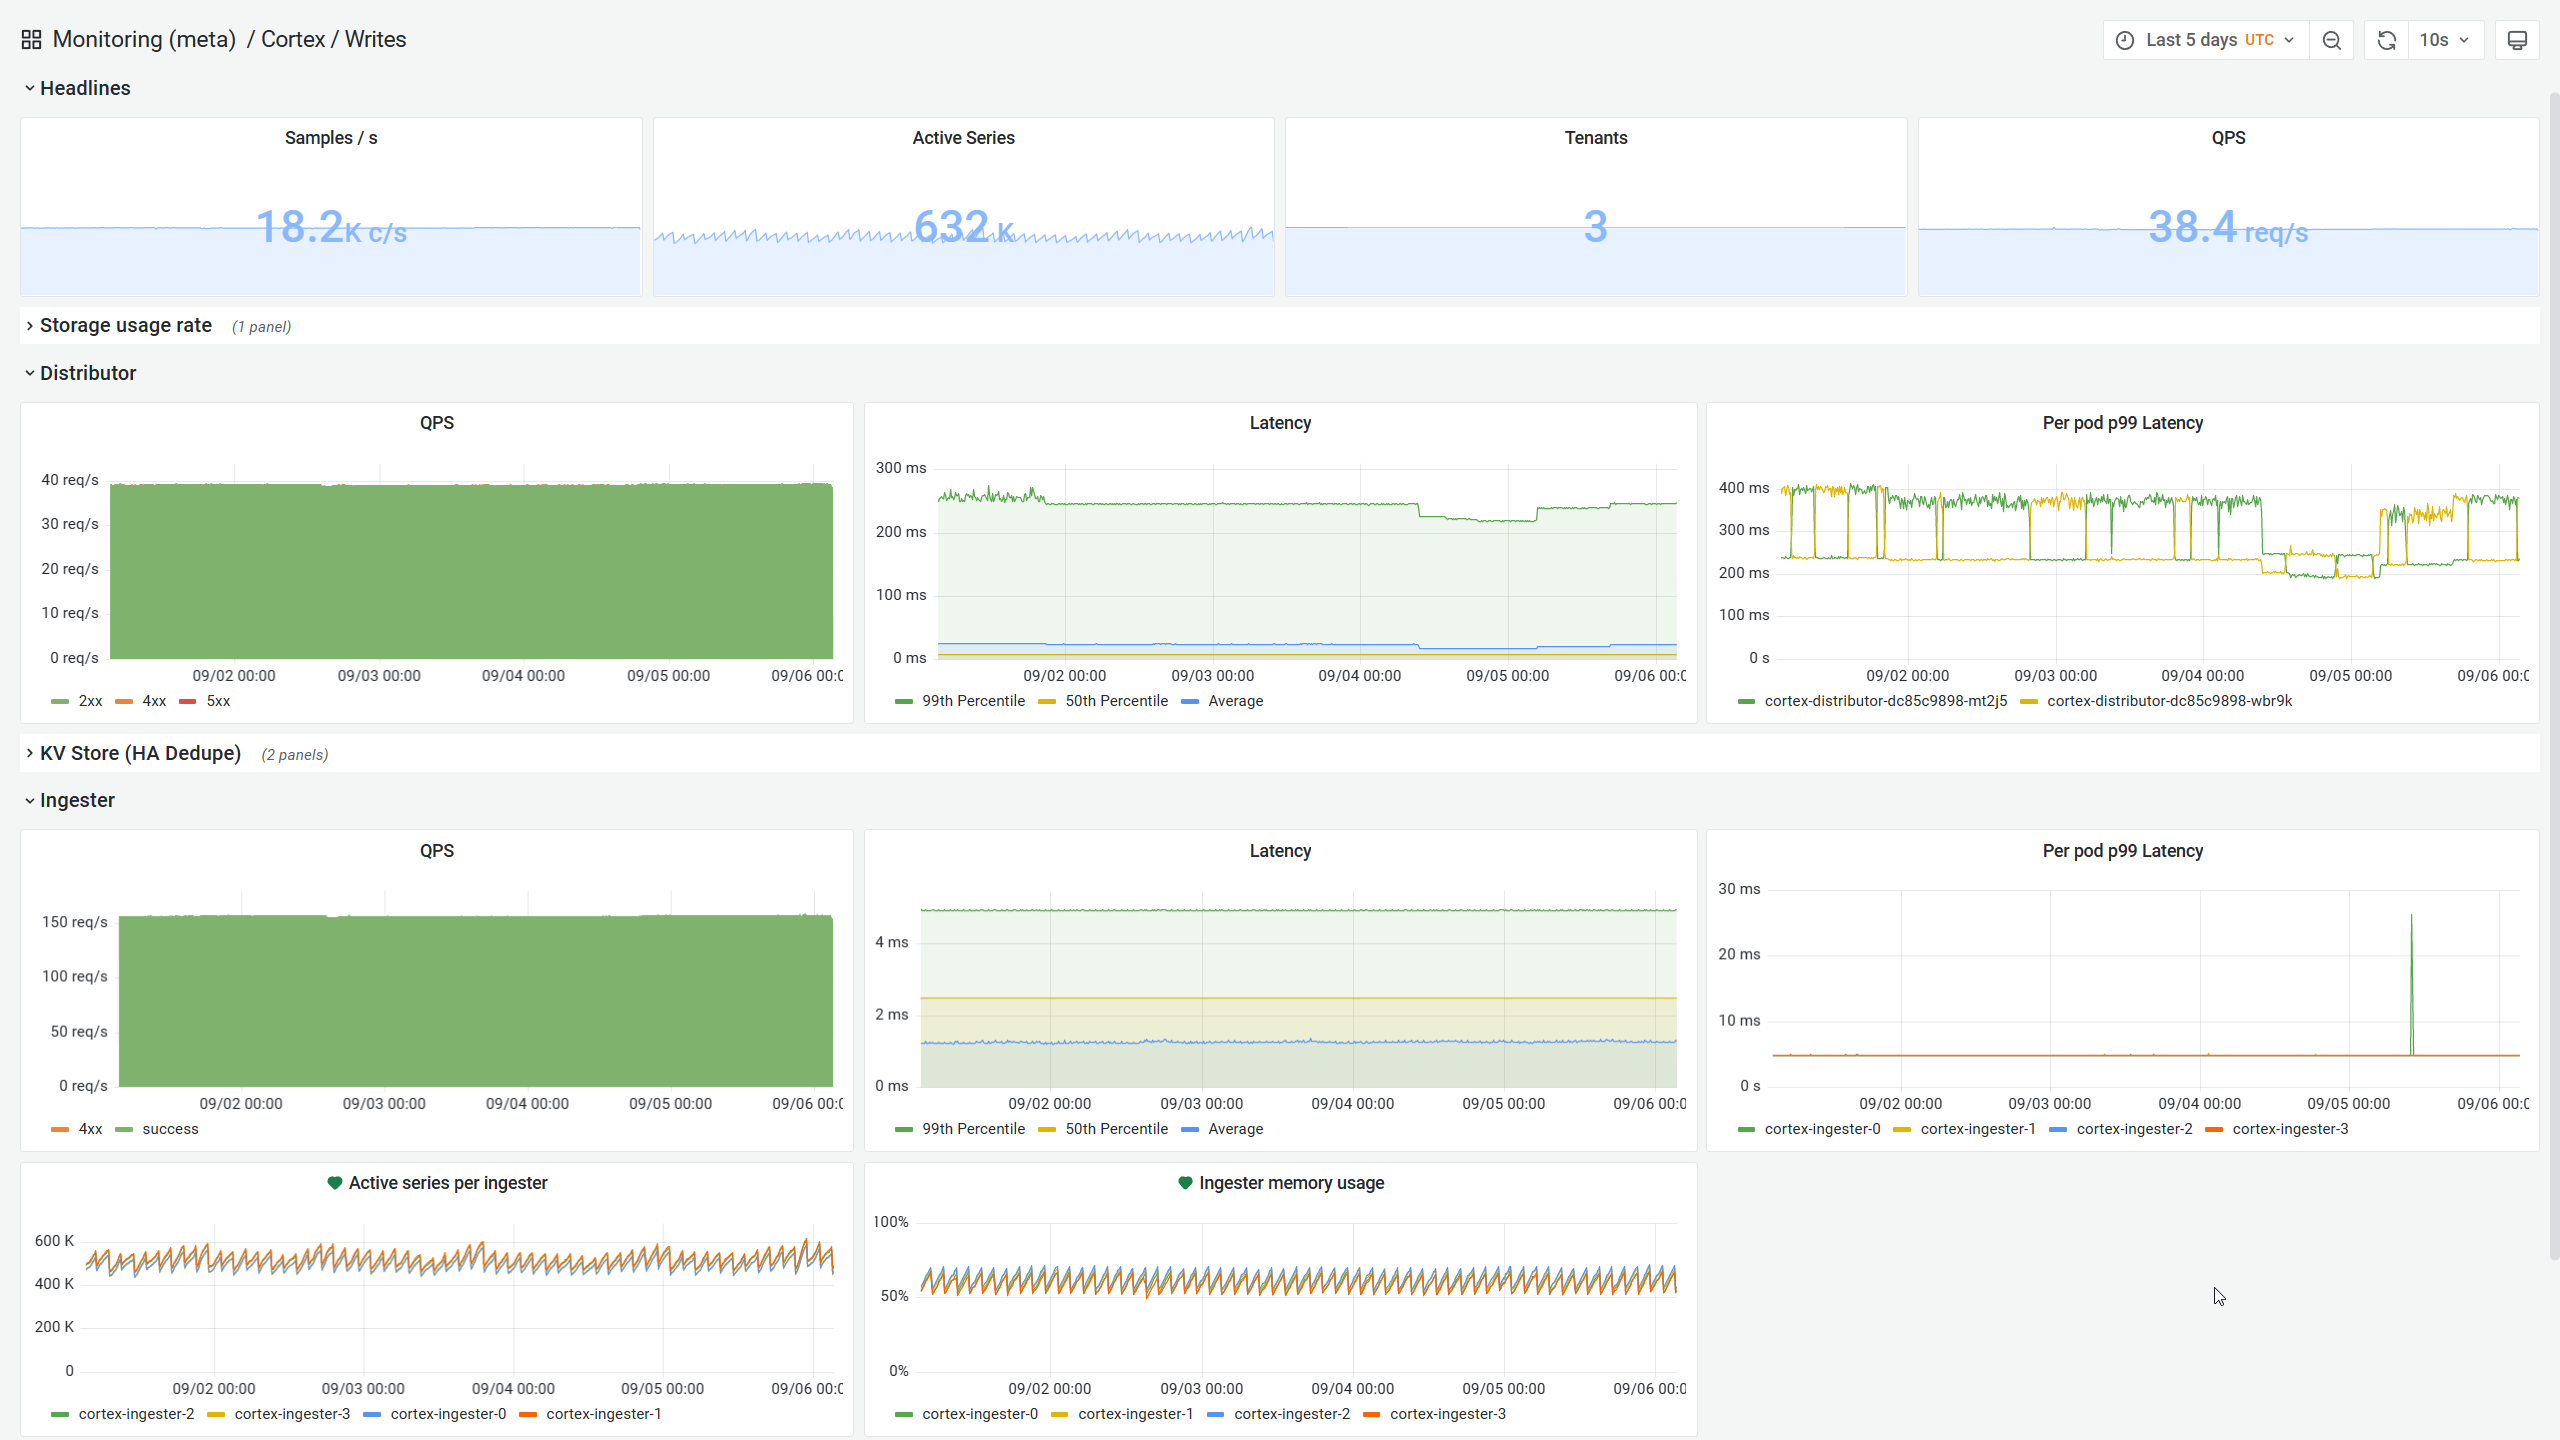
It happens to also support multi-tenancy, which means we can safely use it for our public MangaDex@Home dashboard.
It leverages multiple levels of caching (in-memory tsdb head, in-memory results cache and memcache) to transparently process hundreds of thousands of series over long periods of time alongside being highly-available.
On top of all of that, it manages to stay relatively easy to operate with an impressively small footprint. It really is no surprise that it is what powers AWS Managed Prometheus Service under the hood.
Logs
Logs have historically been a pain point everywhere, but particularly at MangaDex. Indeed, they are costly in terms of processing and storage and most of them are completely useless and will never be looked at. We operate within tight constraints, so dedicating some of our valuable resources to them is not something we are particularly excited about.
However, they are still essential, and with some tradeoffs and Grafana's excellent Loki, we are able to process, store and query a little more than 7000 log lines per second
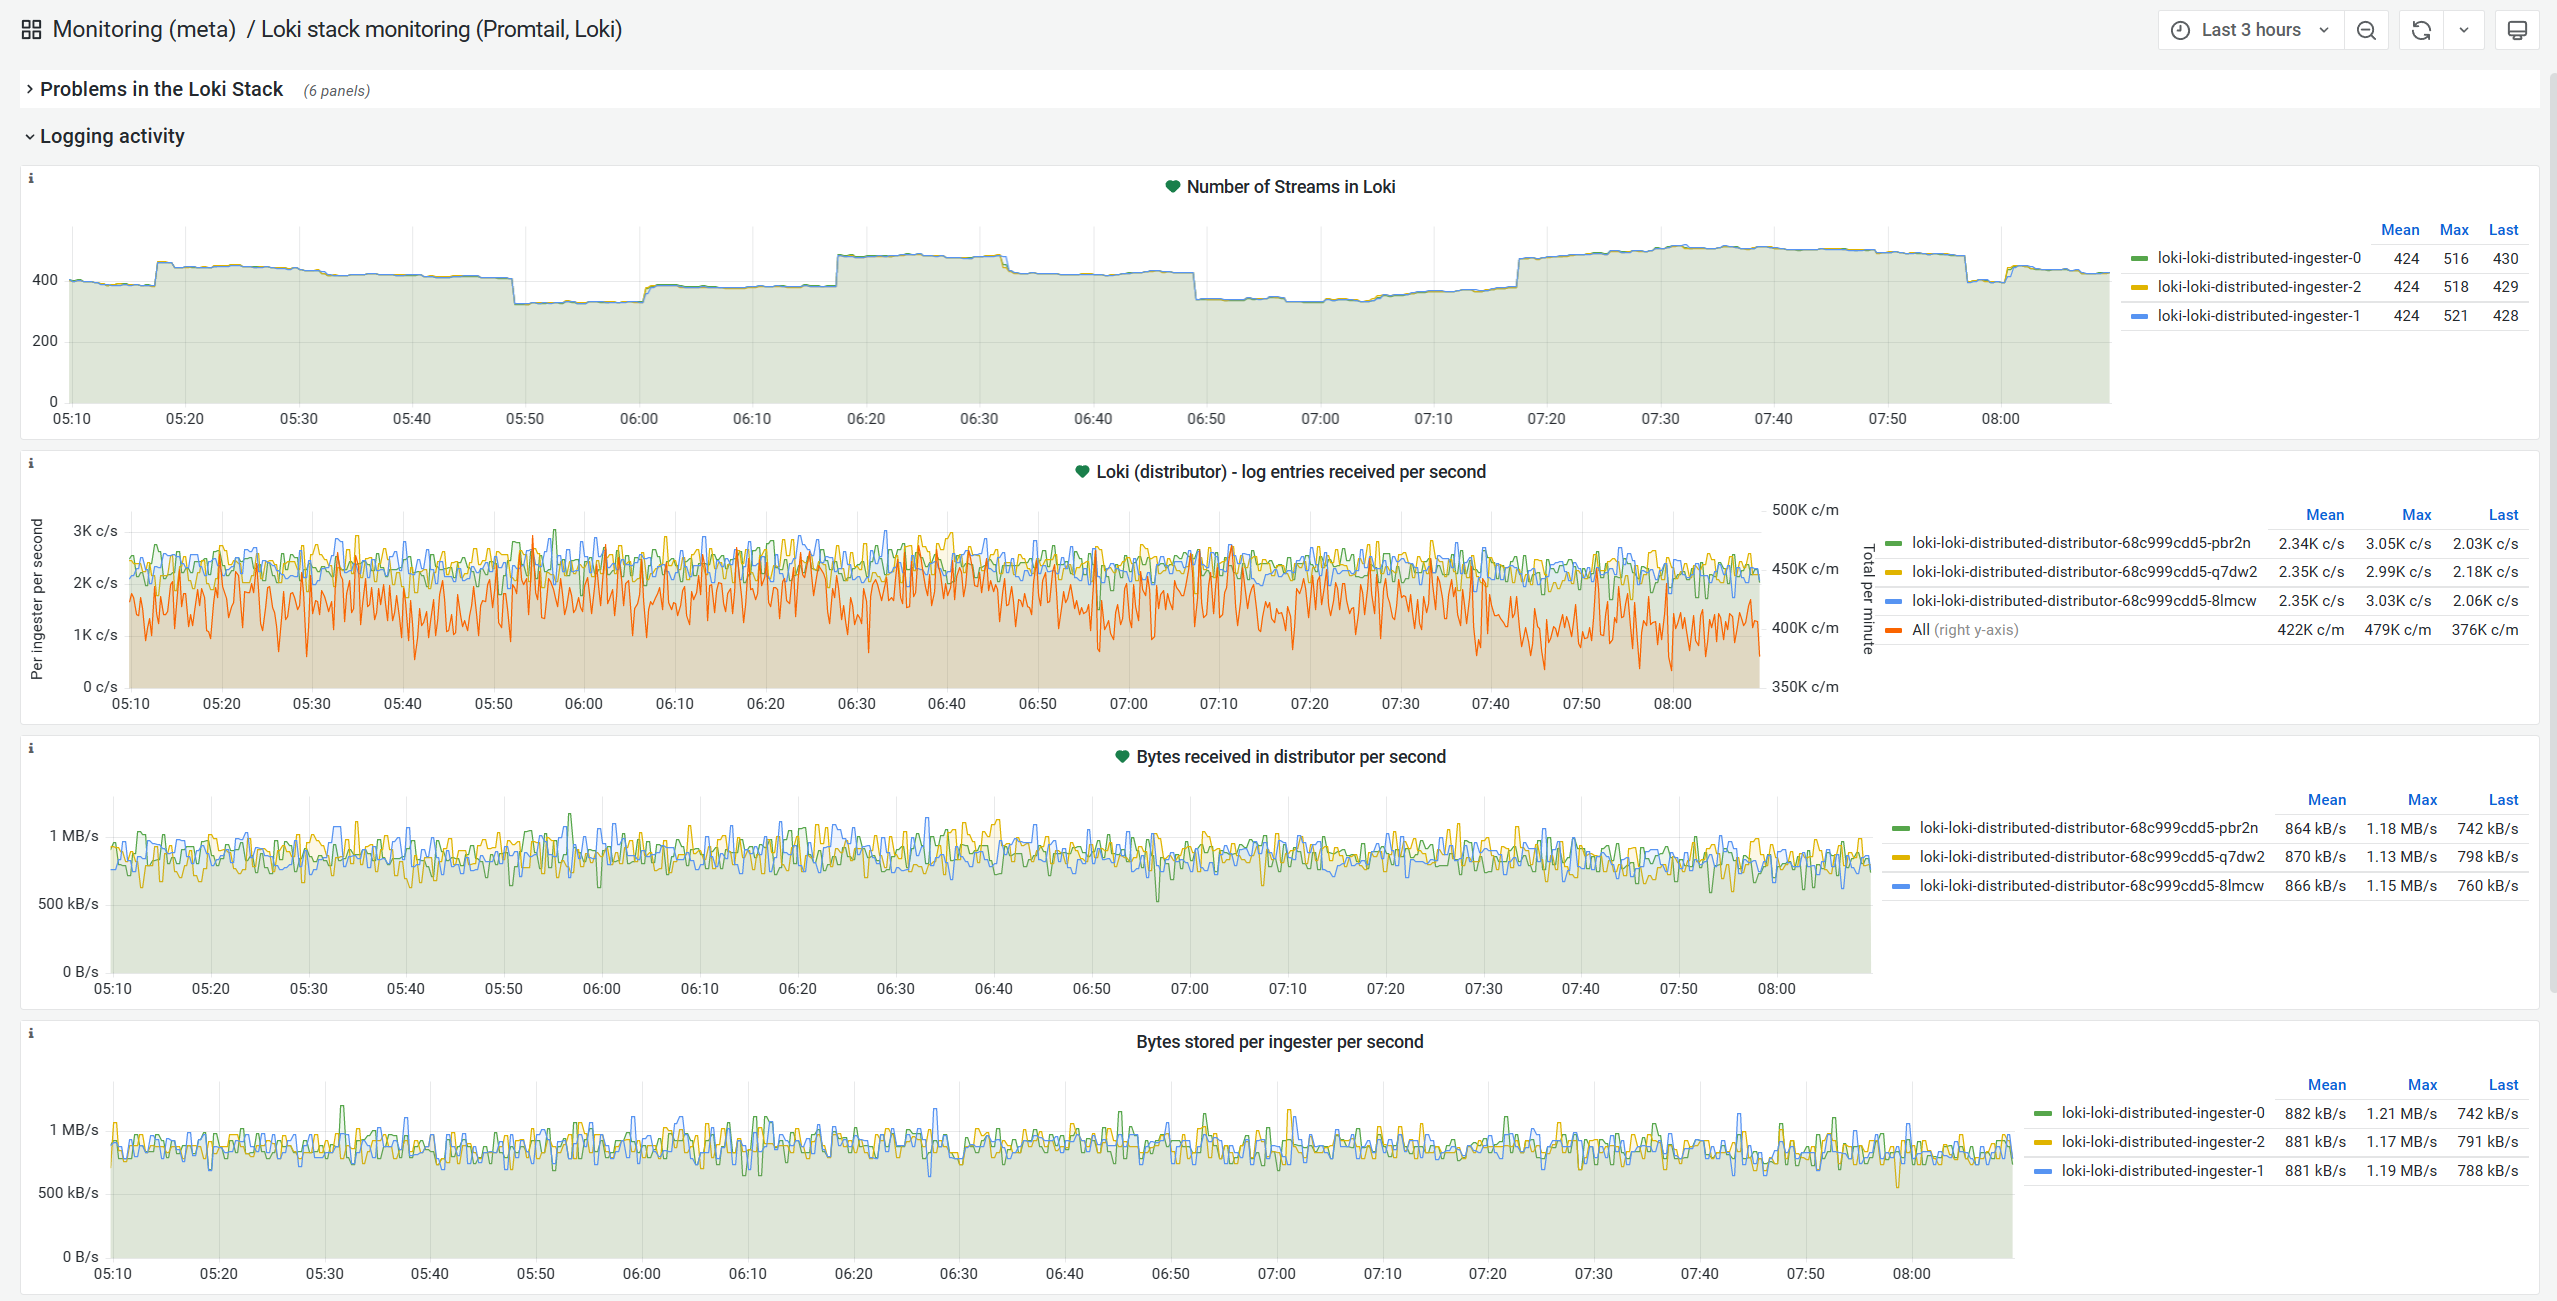
Because this is probably one of the first unconventional stack choices we made, let's discuss it in comparison to the ubiquitous Elastic Stack (aka ELK stack, or its Fluentd-based "EFK" variant), which is the gold standard for logs centralisation. That is, Elasticsearch for storage, Logstash for ingestion and Kibana for search.
While Elasticsearch is an unbelievably efficient database, particularly when it comes to full-text search, it comes with a non-trivial resource cost. It has to build indices suitable for complex textual searches, which is resource and storage intensive. However, this allows it to perform complex analytics and searches along wide timeranges and through a very high amount of logs.
Loki takes a different approach to this problem. It essentially gives up on long-term complex analytics and indexation altogether, which comes with some advantages and drawbacks.
On the plus side, this means that there is no need to dedicate space to massive indices, and that it is able to store logs in a highly compressed fashion. Mind you, being more space efficient doesn't mean that logs do not still take up an absurd amount of space. For this reason, we still limit ourselves to one week of log retention (quite easily configured by using S3 object lifecycle policies)
$ ceph df
POOLS:
    POOL ID PGS STORED  OBJECTS USED    %USED MAX AVAIL
    logs 23 128 804 GiB 706.84k 1.0 TiB 6.70  11 TiB
On the negative side, this means that it offers a more limited feature-set, and essentially has to brute-force its way through any search. You can see it as kind of a very elaborate grep when it comes to the query path.
In its microservices deployment it is thankfully able to largely speed up search operations by dividing the time range of the search into smaller pieces and parallelising this across its querier instances.
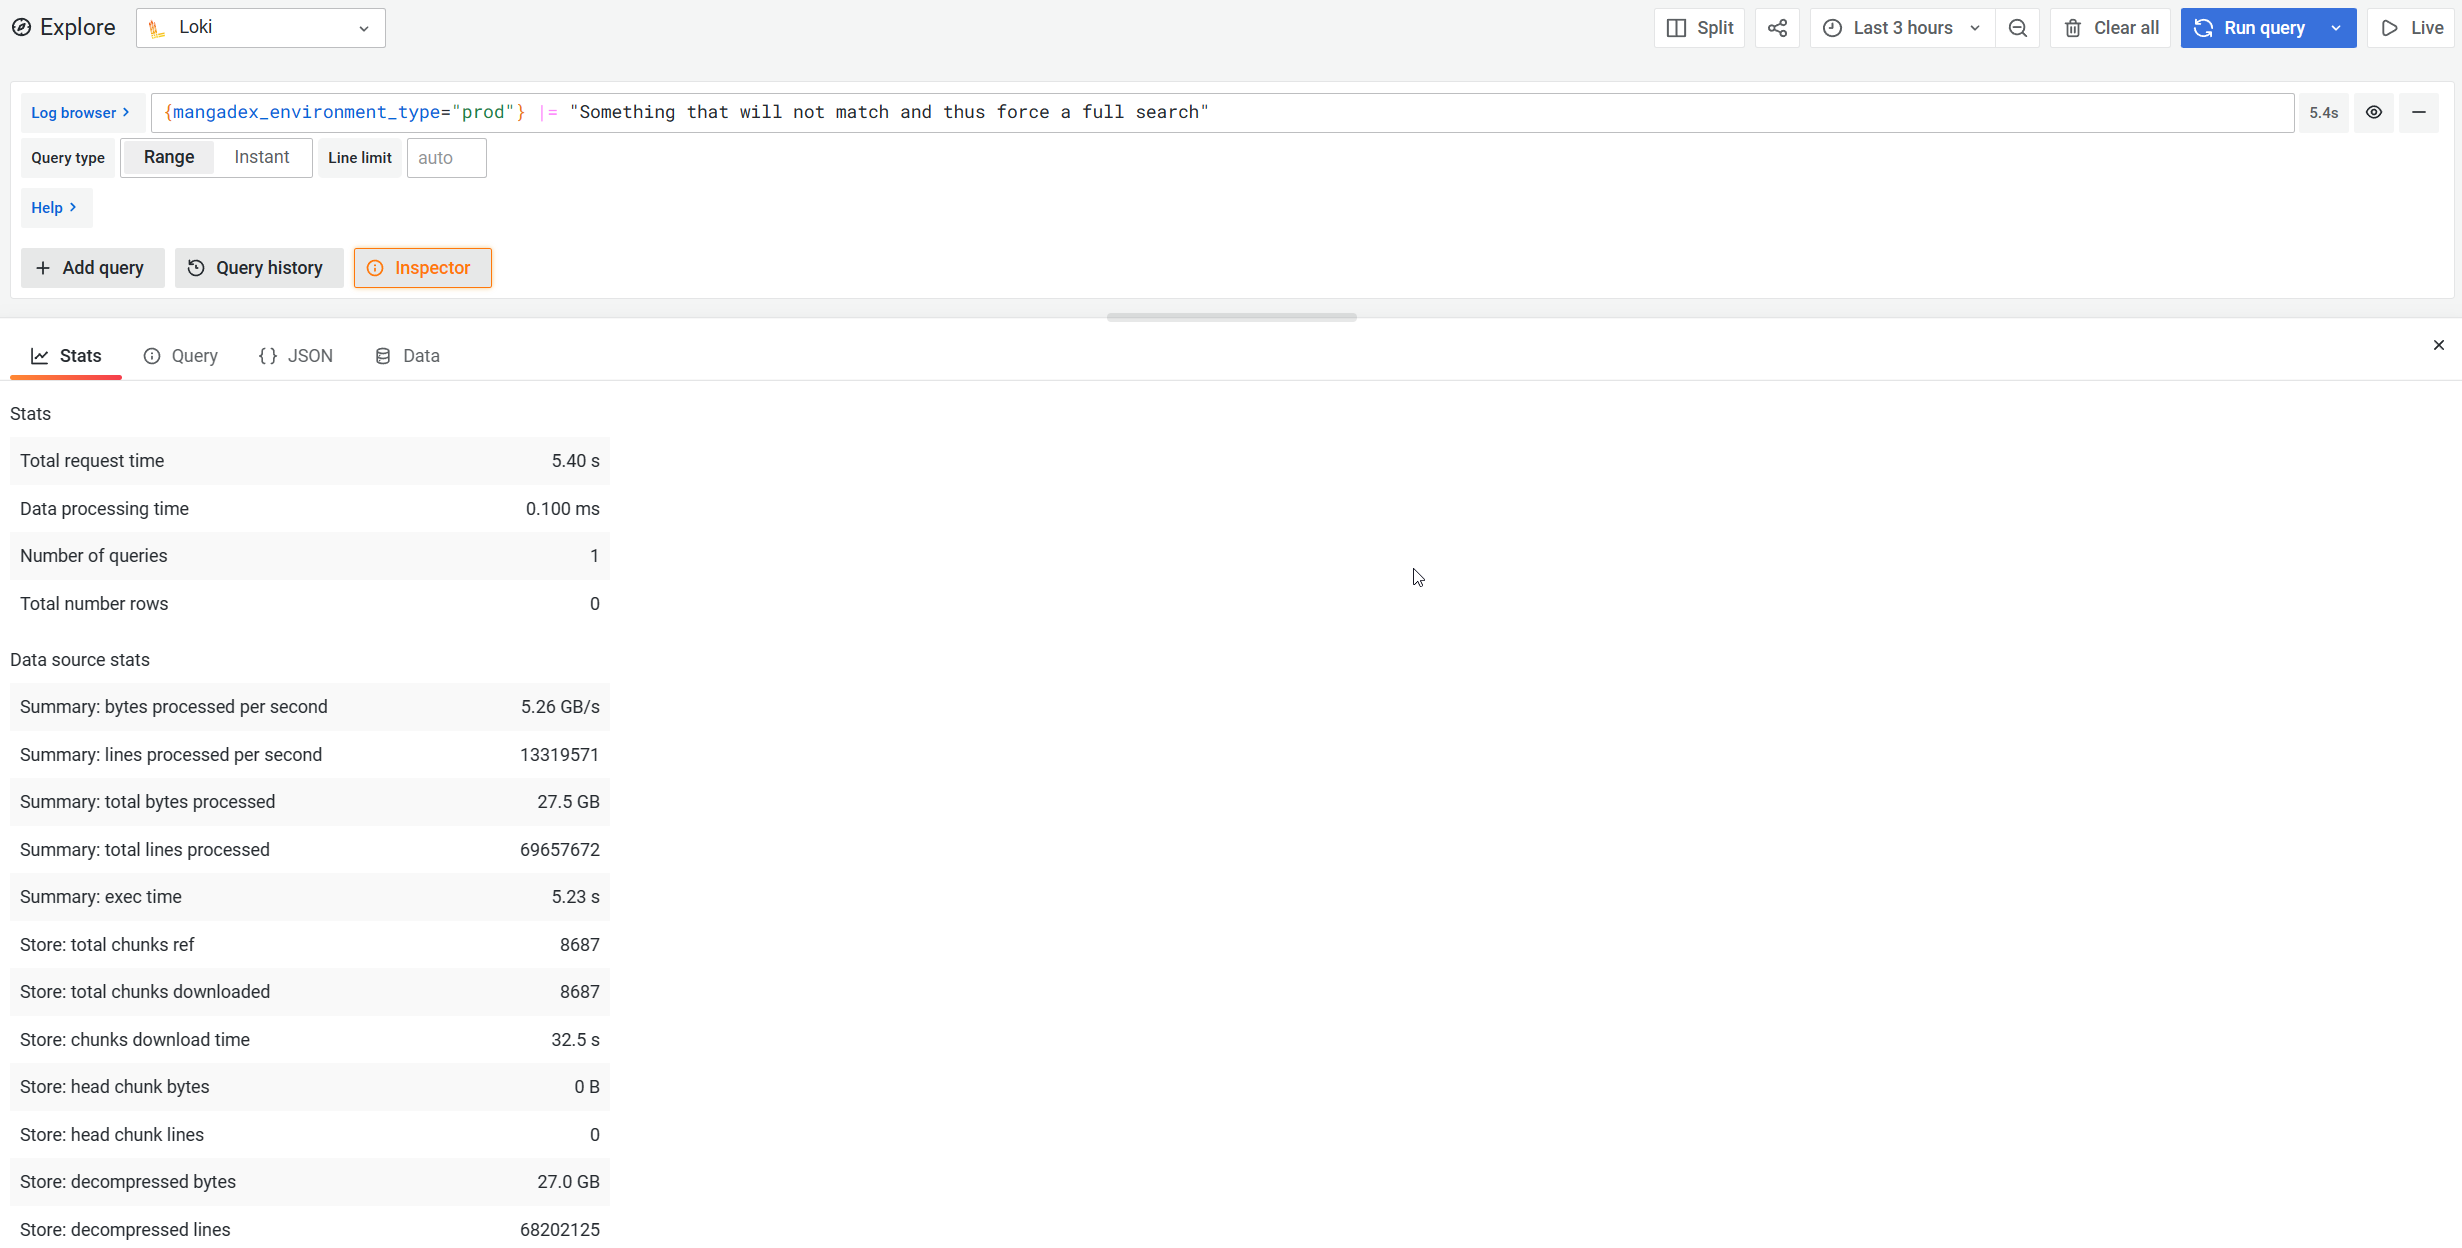
When searching, you are thankfully able to refine the target within your query, which helps it avoid scanning some of the more voluminous streams (i.e. combinations of source and labels) and yields faster queries in the end.
Security and reliability
The site should be immune to human error from a security standpoint.
To be clear, a malicious internal actor is extremely difficult to protect against, but we do take measures to limit how much damage one could do, by enforcing granular and limited access to internal services and keeping tightly guarded backups off-site in the event of a major compromission.
That aside, the only thing we do know for certain is that we are not infallible and occasional good-faith mess ups are unavoidable in the long run. Hence, we need to ensure that the blast radius of such a happenstance be as constrained as possible.
In practice, this means that we:
- run at least two instances of all of our applications
- deploy updates on hosts 1-by-1 so as to catch issues before all of the public traffic hits a faulty instance
- and finally ensure that we can quickly rollback if something goes haywire
From a security angle, we also make sure to run on private networks, and that any user-facing application is kept behind a WAF. For this, we use the popular ModSecurity alongside the OWASP foundation's Core Rule Set and monitor closely or automatically block suspicious requests.
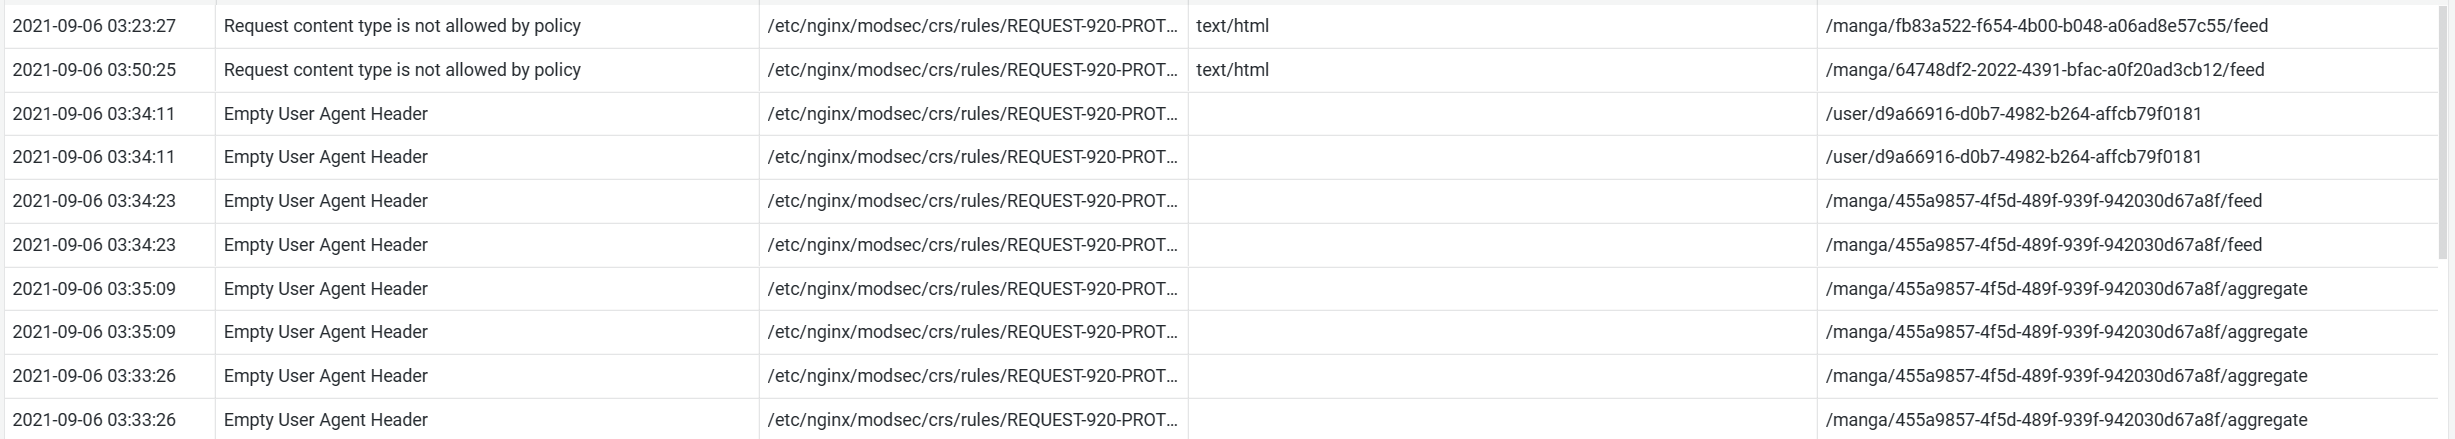
We also stick to other security guidelines of the OWASP foundation, analyzing/updating our dependencies within our CI and relying on defense-in-depth mechanisms at both the host and application runtime level.
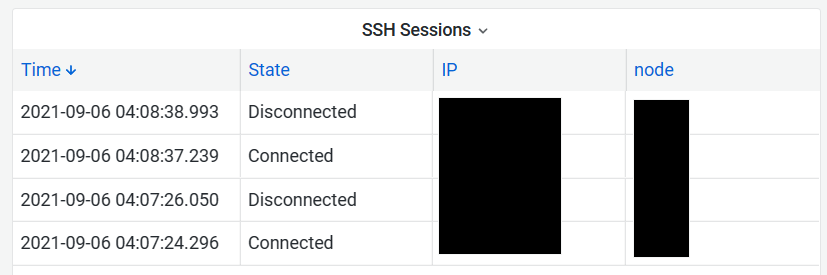
Finally, we also closely monitor all accesses to our hosts and internal services.
Some limits
The most secure, observable, reliable and scalable infrastructure is the one you don't actually have to manage yourself directly.
As the map above shows, we have quite a large amount of load-balancers, gateways and reverse proxies, which certainly doesn't keep things simple. However, sometimes you have no choice, and with MangaDex this is particularly true.
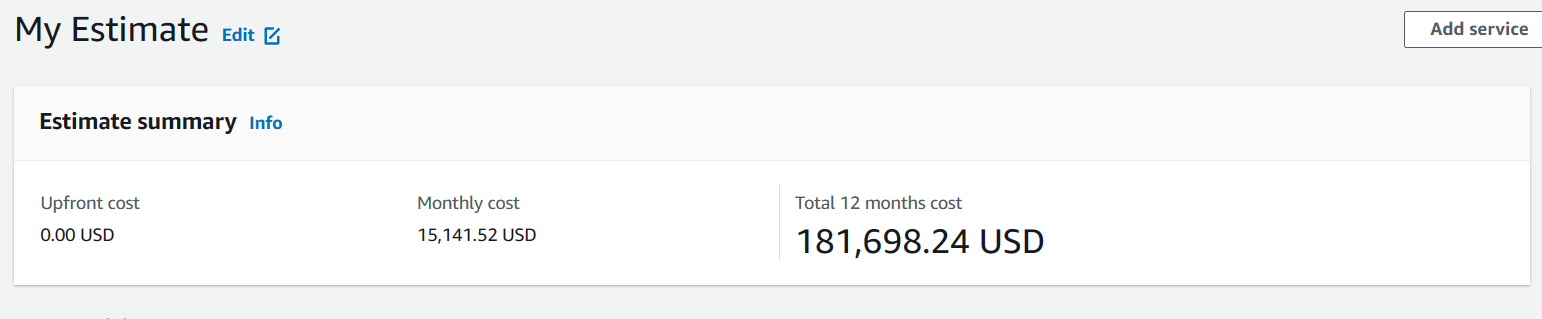
We would certainly massively benefit from using one of the major cloud providers (AWS, Azure or GCP), but alas their cost structures are very much engineered towards companies that can actually expect some revenue, not stingy customers like us5...
For fun, here is an absurdly conservative estimate of what our bill would look like if we ran on AWS...
On a related note, we have relied on Cloudflare's excellent services in the past but that is unfortunately not an option for us anymore for privacy reasons.
All in all, this means that we have to hand-craft everything about our infrastructure. Network, databases, security, etc. We also need to make sure we are not tied to any single service provider's goodwill, should they suddenly decide to change their mind about working with us.
Parting words
This has been a fairly long post so far. It focused on the very basics of our infrastructure: the virtual machines provisioning, the operating system and configuration choices we make and the observability and security capacities we built into all of these. I hope you liked it and that it gave you some ideas to try out for yourself.
In the meantime, look forward to the next part in this series, in which we will discuss how we route traffic and build and deploy our applications.
Notes: