Good luck, I'm behind 7 proxies!
~ Anonymous, 2007
This (slightly altered) catchphrase, generally used in jest, suggests high operational security. Today, however, it is an excuse for us to discuss the various layers of proxies, caches and load balancers that MangaDex currently makes use of to distribute and route traffic to and back from our applications for optimal performance and reliability.
Since the previous installment of this blog series, we have been pretty busy and we'd like to share some of our findings and choices with you. While all of this is merely the current state of our deployment and is subject to future change, we hope you find some interesting takeaways.
At the edge
Our previous network iteration had two major limitations: a high latency penalty for geographically distant users and no straightforward way to avoid being affected by occasionally congested (or faulty) international network routes.
Turns out, these two (usually minor) penalties quickly compound when your users regularly range in locations from the west coast of the United States all the way to South-East Asia (and even further away, on the flip side of the world; hello, friends from New Zealand!). Specifically, a little over 60% of our traffic has to travel across regions between end-users and us.
To fight back on this front, we have introduced an edge network on the outskirts of our infrastructure. This has already given us some powerful ways to optimise for our traffic patterns and opens us up to many other future network and infrastructure improvements. In practice, our topology is currently as follows.
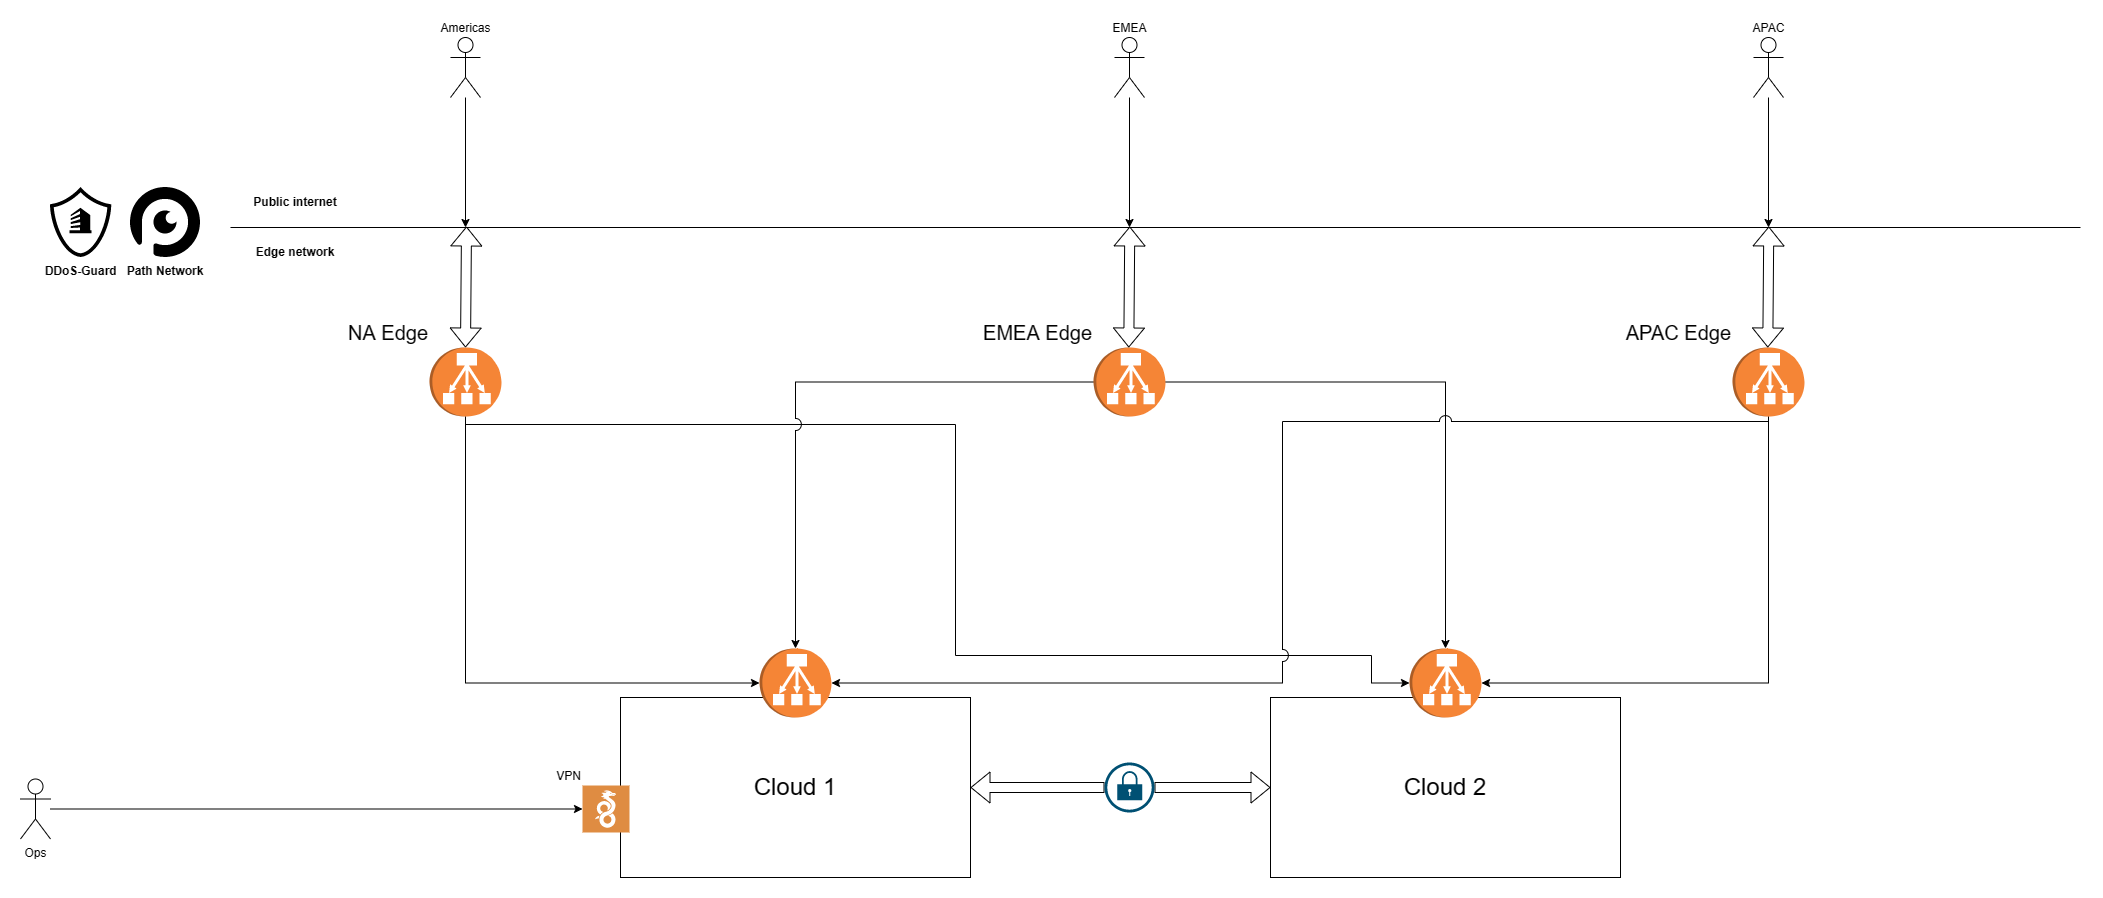
We replaced our two external load balancers with multiple smaller virtual machines, spread in each of our three main regions first, and subsequently in multiple cities within each region (not represented individually here). This ensures proximity and redundancy of our services no matter where our users are physically located1.
While they are points of entry too, they, more importantly, serve as geographically distributed caches and the first line of defence against abusive traffic. Our long-term goal is to process and serve as much traffic as possible directly from the edge, without the need to forward most requests to our core cloud regions at all2.
At the time of writing, we use HAProxy as frontend with (up to) two distinct local cache layers, depending on the request being handled.
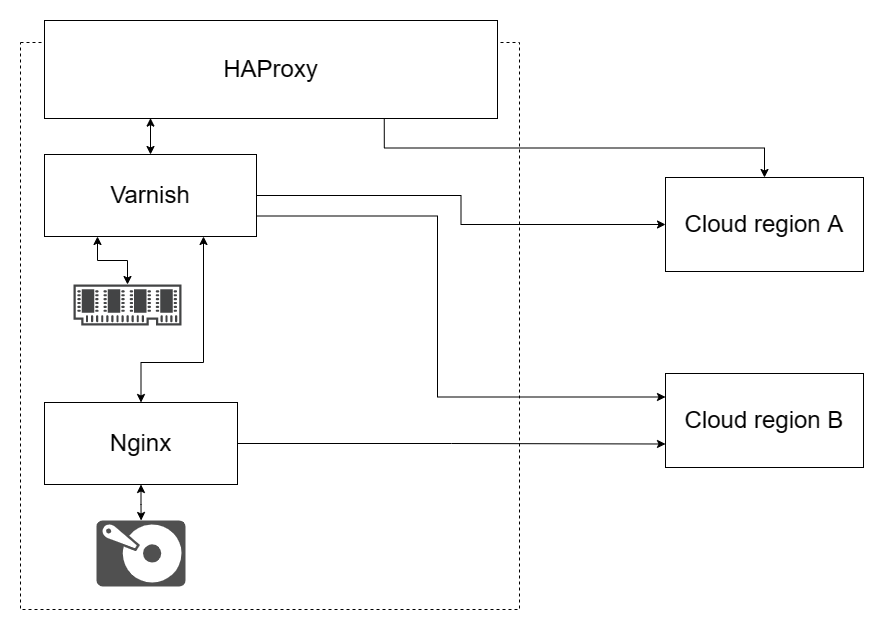
Once a request has been deemed valid enough3 by HAProxy:
- Varnish is used as an in-memory cache for the most frequently accessed small-to-medium-sized content (API requests and cover thumbnails).
- nginx is used as a second layer (with proxy_store) to create a disk-based persistent cache for medium-to-large content with limited cardinality (full-size covers4 and their thumbnails notably). Note that while nginx works adequately here, we will almost certainly replace it with Apache Traffic Server in the long term due to more flexible options for this use-case – this is additionally largely inspired by Wikimedia's HTTP caching strategy.
This currently results in us serving between 20% and 30% of the incoming requests straight from the edge. This is already a welcome saving, but through some upcoming changes to both our Varnish configuration and our backend, we will soon be able to push this to an entirely new level. Indeed, we expect these changes will allow us to eventually serve most API requests purely from the edge.
But it doesn't stop here. To make this even more beneficial, we take advantage of our reverse proxy partner Path Network and DDoS-Guard's services also running their own edge networks to always meet them in the most latency efficient way possible, in the same region as the end-user. This means that they get to keep traffic to us local within their own networks, instead of potentially funnelling requests across entire continents and back to reach us, which further improves performance and reliability.
And we're still not done! Since we decided to have edge deployments in multiple cities per region, if one of them suffers degraded quality of service for a reason or another, we have the option to simply pull the affected edge deployment out of our network altogether until it is resolved, essentially shielding ourselves from regional network failures by shifting regional traffic between cities as and when necessary.
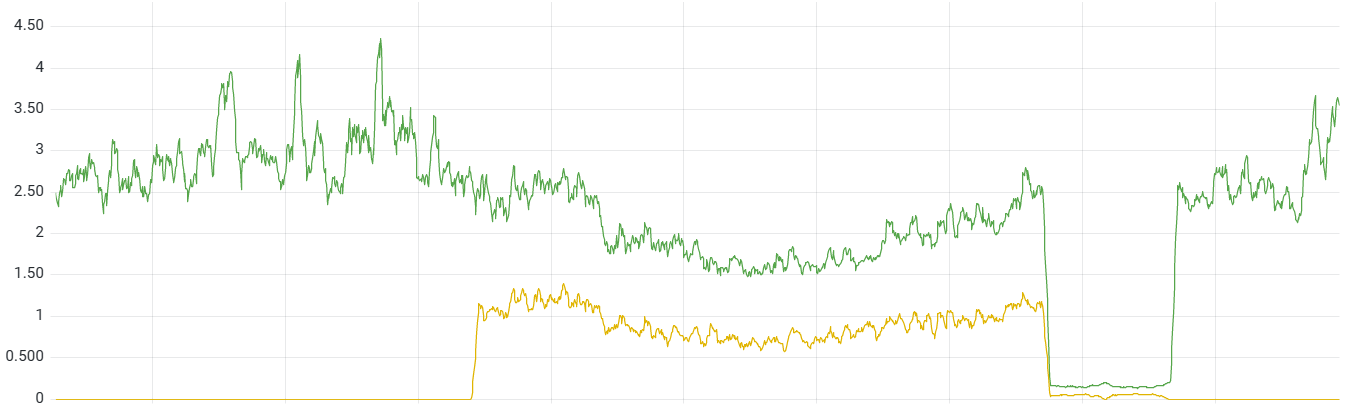
While one would expect global internet routes to be perfectly reliable, this has not always been our experience. Thankfully, we are now able to fix first and then investigate such issues, instead of being stuck proceeding in the opposite order, usually waiting on an open ticket in a support centre somewhere while our site is near unreachable in an entire region.
One recent such case is pictured above. It ended up being a major internet exchange (IX) having a faulty switch link, but on our end it looked like a significant amount of TCP connection failures between one specific edge deployment and our internal network, which we were also unable to reproduce reliably5.
We waited a bit first, in case it would be resolved promptly, and eventually just pulled the deployment out of the network altogether. This meant the issue was fixed and our services went back to normal multiple hours before we heard of the problem (and root cause) from the IX via our provider.
Overall, this edge network has been a powerful tool, and we plan to continue relying on it more and more as we go.
Picking a load balancer
The previous section outlines our choice of technologies at the edge, and they are not the result of chance. When designing our infrastructure, we expect all of the software we make use of to be:
- Performant for hardware cost reasons.
- Reliable as we have enough bugs of our own to deal with those of others too.
- Observable so we discover (and hopefully fix) issues before users do.
With those requirements in mind, HAProxy is criminally underrated and simply cannot be praised enough6. Feature-wise, it offers all of what we currently need from our load balancers:
- TCP proxying at both Layer 4 and Layer 7.
- Deeply configurable backend health checks, weights, retries and circuit-breaking.
- First-class support for SSL termination.
- First-class support for logging through syslog.
- A friendly yet flexible configuration language.
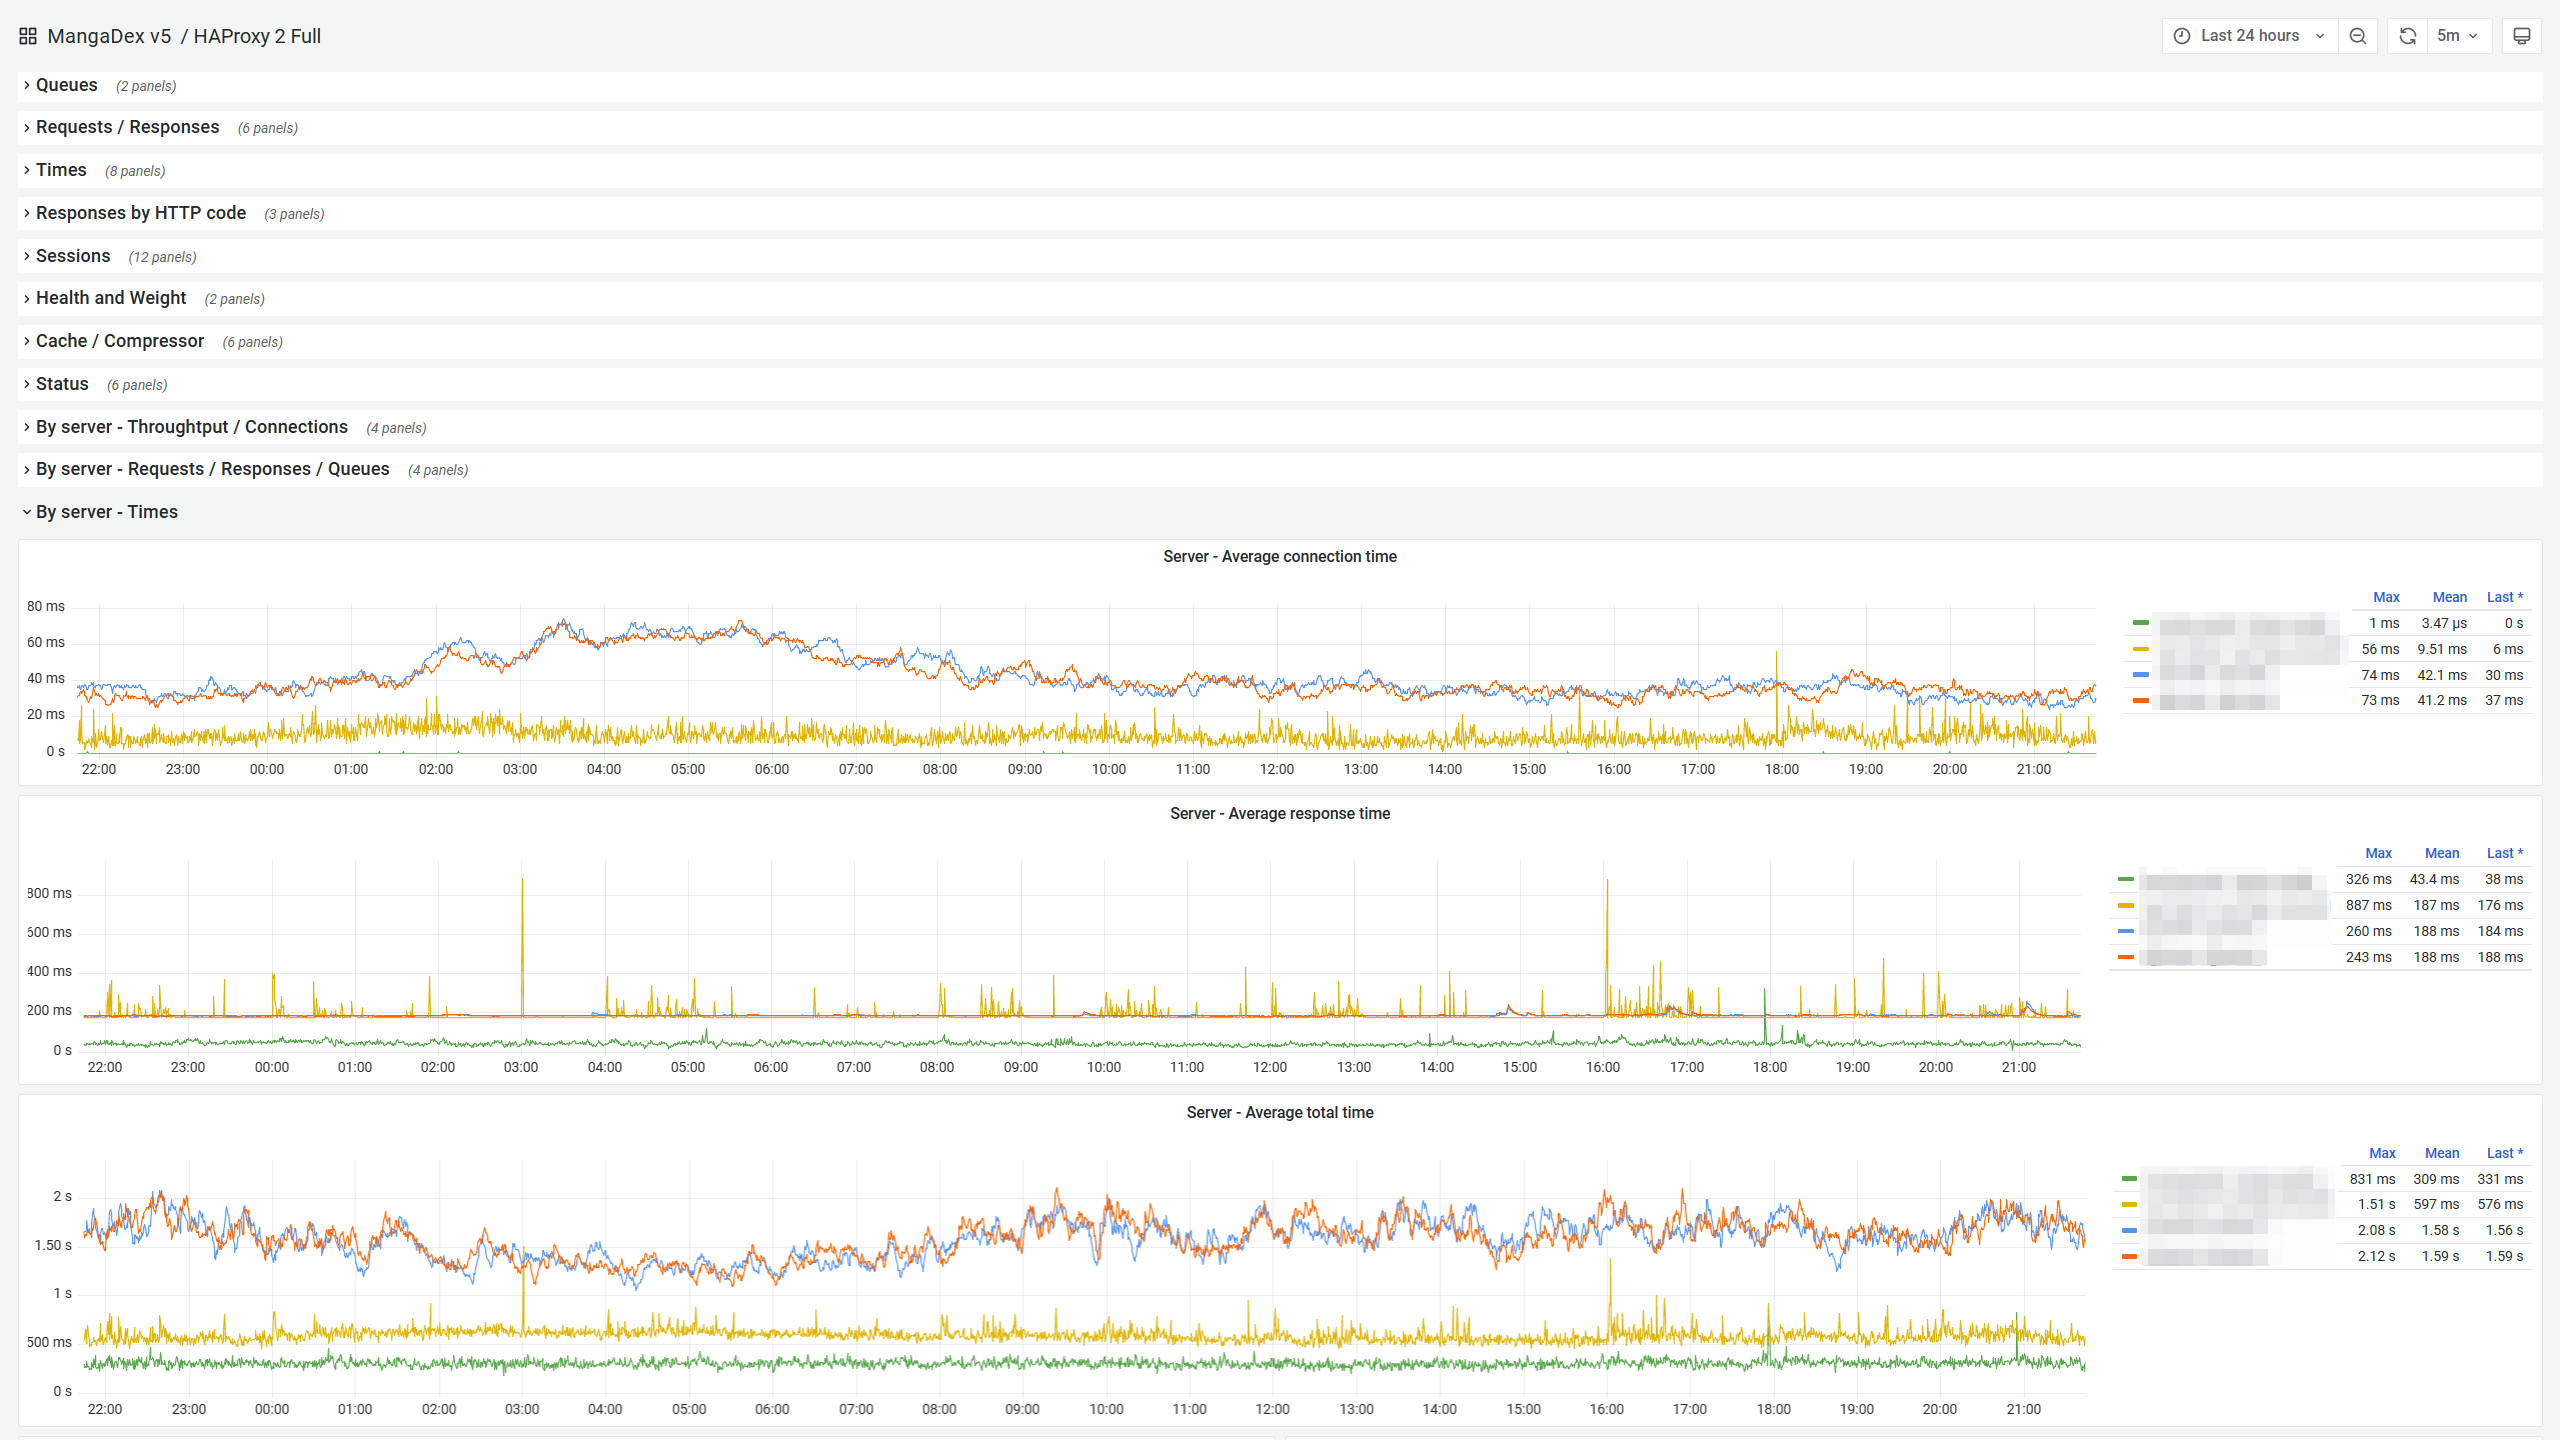
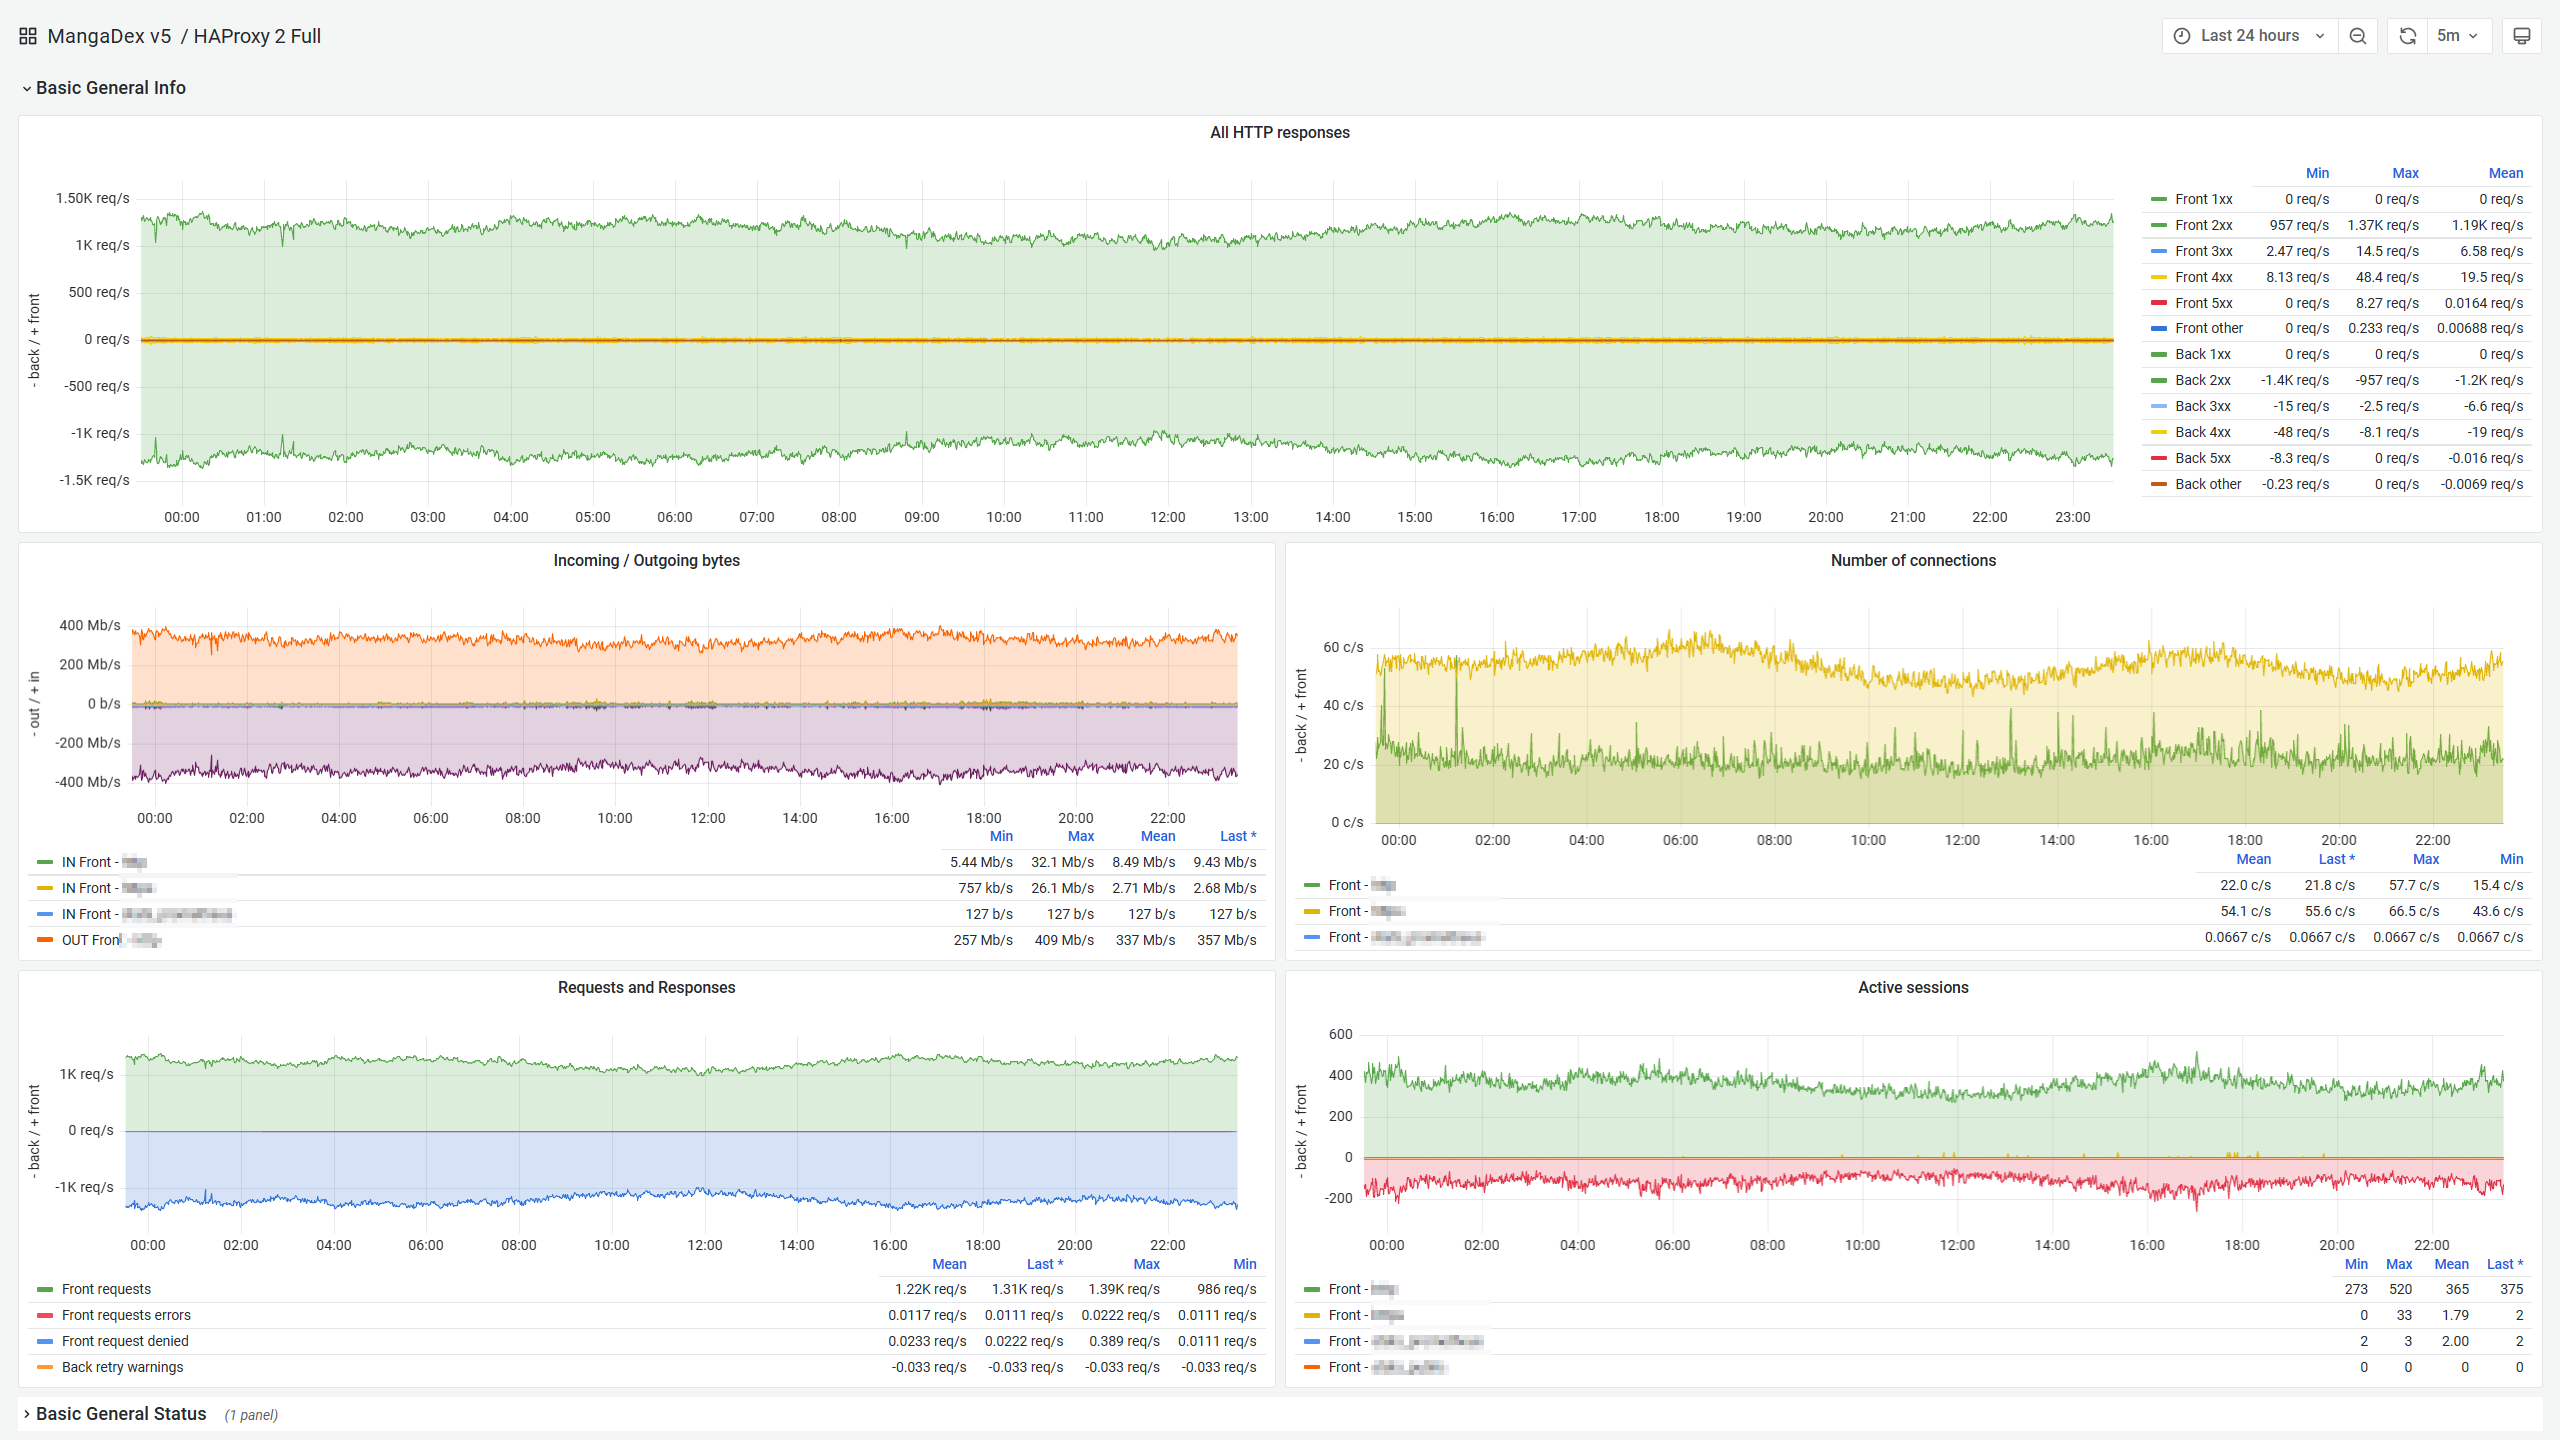
However, what ultimately distinguishes it (for us) is the unparalleled observability it offers out of the box. With native first-class support for Prometheus too. It allows us to use (a heavily edited version of) this excellent Grafana dashboard for in-depth live monitoring of each instance.
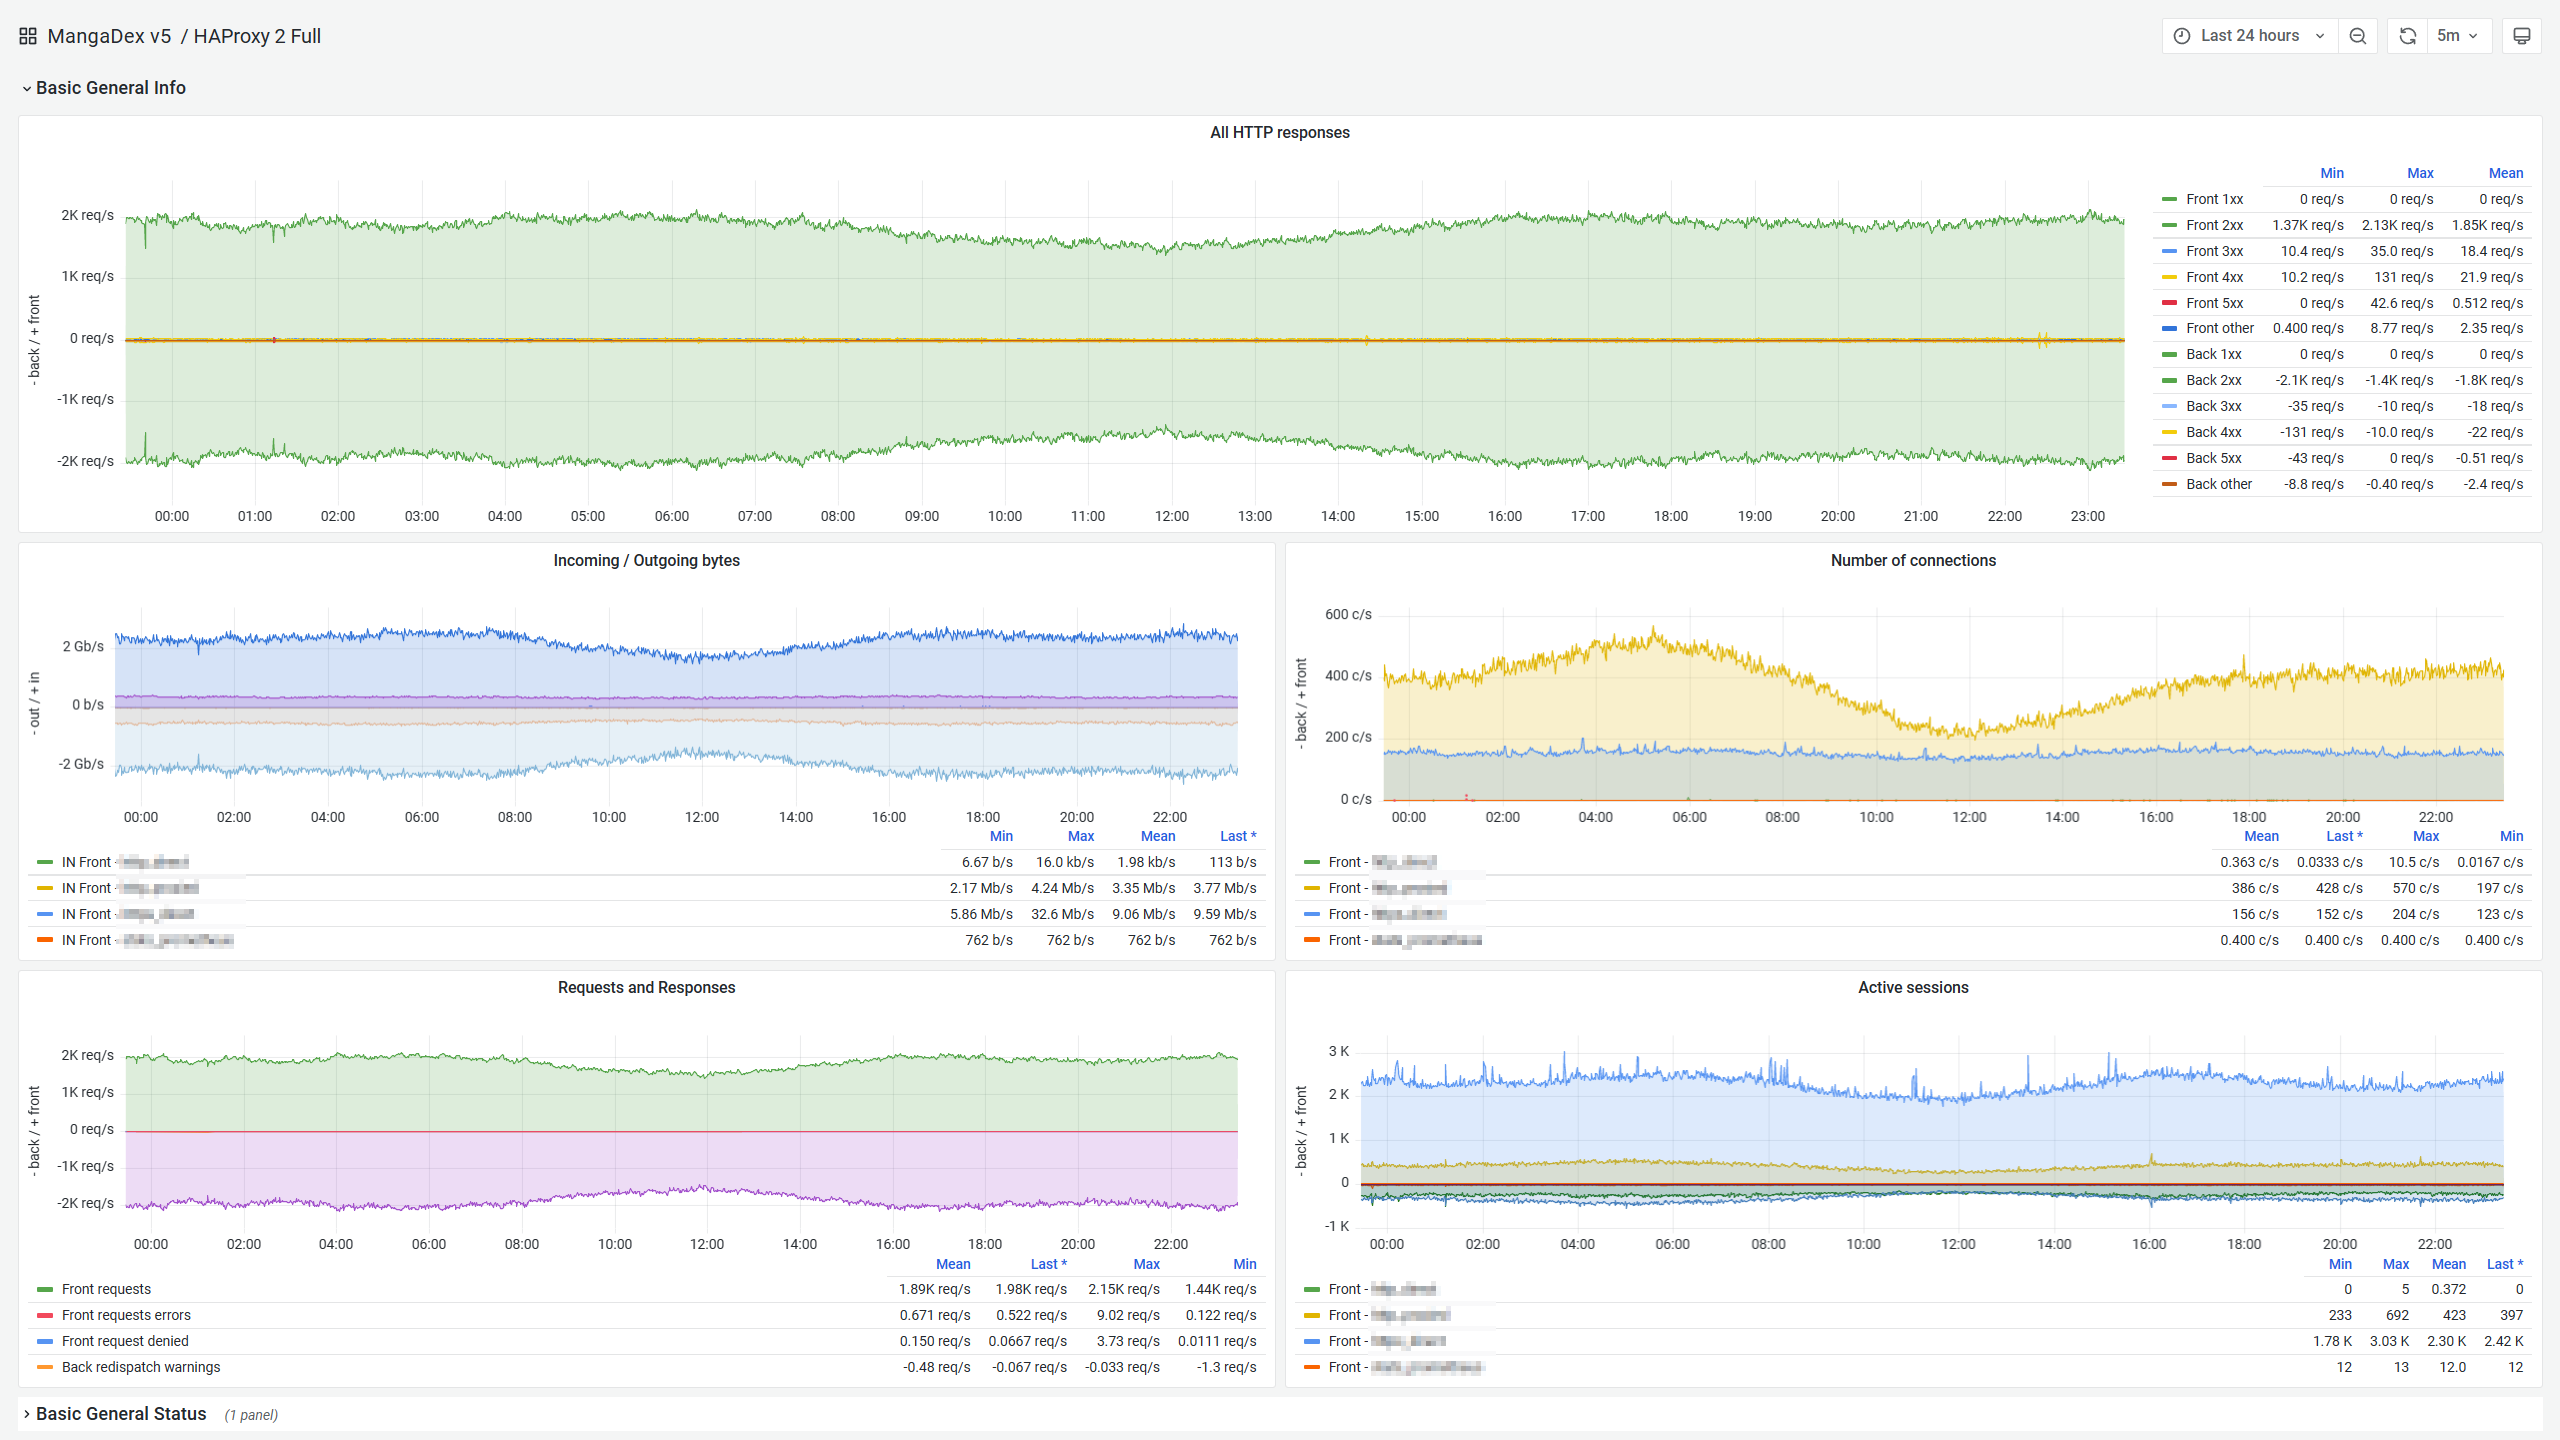
Note that this is only a very small part of the metrics offered, and you get further breakdowns per frontend, backend, and even by individual upstream server. It is truly a goldmine of information and makes monitoring the global health of our infrastructure a pleasure.
As a result, we use it nearly anywhere we need load balancing, with confidence that it will perform well and that we will reliably know if it ever stops doing so. Be it at the edge, within our core network, or as a Kubernetes cluster load balancer and ingress controller. You name it, we (most likely) use HAProxy for it.
No software is perfect, however, and there are a couple of drawbacks and limitations to be aware of when choosing HAProxy:
- It is specifically a TCP proxy and nothing else, so it doesn't support UDP7 in any fashion and cannot be used as a (file) server by itself either.
- The official documentation might as well not exist at all; thankfully, you can use the excellent unofficial HTML rendered HAProxy documentation by Cyril Bonté instead. You will still generally find less documentation for it than for the likes of nginx in general, due to the disparity in popularity.
- Some of the more advanced features (SPOE and stick tables general counters notably) can have a rather arcane configuration syntax, unexpected behaviour, and limited documentation altogether.
Overall it still strikes us as being nearly perfect for our needs. We can also happily recommend Vincent Bernat's HAProxy PPAs if you run on Ubuntu Server too and prefer tracking the HAProxy mainline for your deployments.
Nginx and Varnish as non-choices
Since we make use of both nginx and Varnish within our edge (and sure enough, in other places too), we also evaluated them as load balancer choices but decided against each for different reasons.
nginx is one of the most deployed reverse proxy/load balancer/webserver. And it offers excellent performance as well as a feature set that is largely comparable to that of HAProxy. However, its community edition is lacking in some areas:
- An obscene8 lack of metrics, pretty much useless for anything but a couple of very high-level information.
- Very limited flexibility when it comes to managing backend healthiness at runtime (no fine-tuning for weights, retries, and circuit-breaking...).
- Poor and poorly documented support for logging via syslog.
However, the emphasis truly is on "out of the box" here. nginx is still a marvellous piece of software, and many companies, like Cloudflare, make heavy use of it with great success, notably by relying on its support for LUA scripting, which allows nearly endless extensibility. Widely deployed projects like OpenResty are further proof that you can reliably build entire products atop it with that approach.
Its configuration language also has the advantage of being less verbose than that of HAProxy for simple configurations. And where we just want a simple, reliable and fast HTTP web server, we do rely on it. However, somewhat more complex usage generally relies on going the LUA route.
In the end, it is still a great choice for a wide variety of use-cases. Just not quite the one we were after for our current load balancer fleet.
Varnish also has support for load balancing. And very fancy (sharding and caching) load balancing at that. Its configuration language, VCL, is also rather pleasant to work with. It also does better than nginx on observability, even if it fails to meet HAProxy on that front. It even has a flexible logging system that would easily plug into a syslog sink.
However, its community edition cannot be used for SSL termination, nor with SSL backends. That is unfortunately a non-starter for us. And while Varnish Software has a second product, Hitch, which is geared towards complementing this need, it has seen limited adoption and support so far. Finally, the scarce documentation available makes it a somewhat risky choice for us overall.
A note on logging requests
In the previous section, we mentioned the need for our choice of load balancing software to support logging to syslog. While logging requests exhaustively and efficiently remains a pain, a privacy liability, and generally also a massive resource sink, investigating bugs and being proactive when it comes to security and threat analysis demands it. However, at our traffic levels, just logging all of these to disk is not a reasonable option.
File-based solutions simply fill hard drives too fast, even with the likes of logrotate9. And even with awkward tricks to force it to run on a tight schedule, it still causes unnecessary space and IO pressure, and might eventually result in dropped logs at best and non-functional VMs at worse (since we do rely on the disk space for persistent caching at the edge).
Instead, we prefer to use rsyslog and Promtail's syslog listener which reliably ships all of this in near real-time to our monitoring infrastructure, without requiring more than a negligible amount of memory usage for the occasional buffering/retry.
Back to our proxies.
The internal networks
So far, we have seen 5 different proxies, at various levels (Path and DDoS-Guard from a public standpoint and our edge HAProxy/Varnish/Nginx layer), and we now reach the entrance to our internal networks.
The internal load balancers
You guessed it, each of them is gated by yet another HAProxy. While our edge enforced the first layer of somewhat lax rate limit policies, mostly to stop clearly abusive behaviour, this one does a few more things from enforcing global API rate limits to the obvious last mile of requests routing towards a healthy instance of the application they are ultimately destined for.
At this point (6 proxies later) and depending on the application, you will either hit an application (VM) directly or a Kubernetes Ingress Controller on the way there.
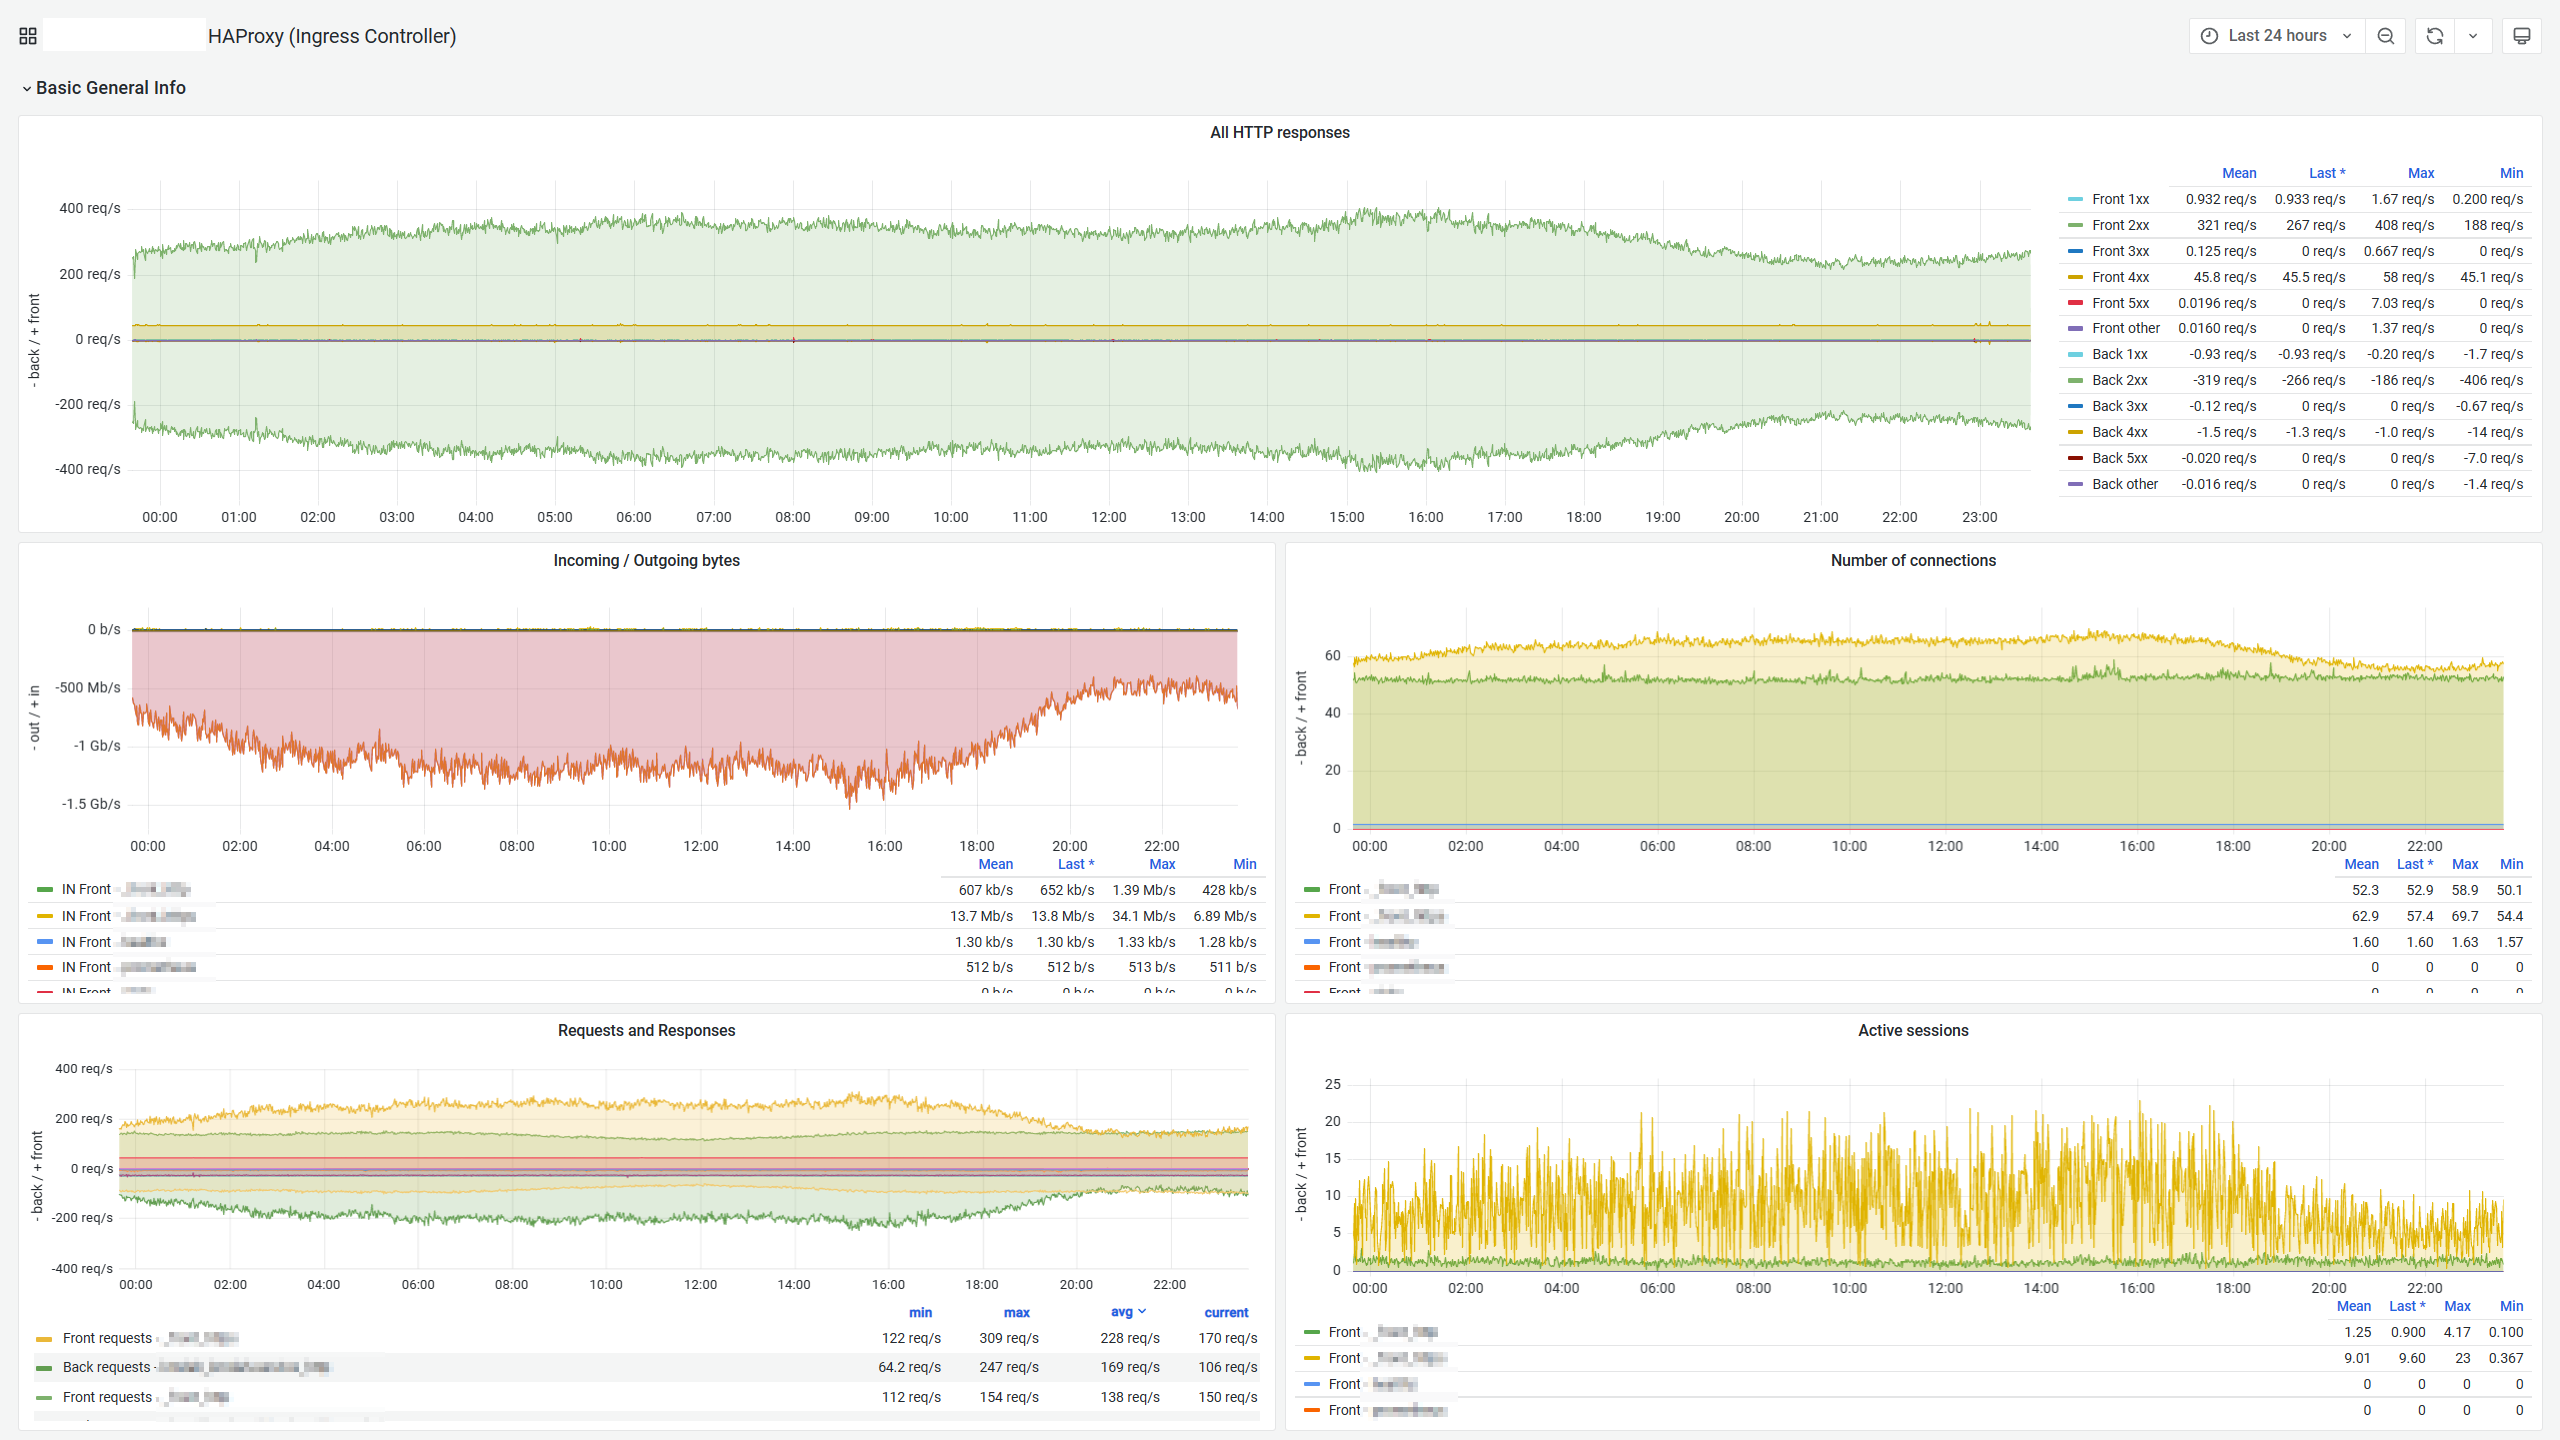
In the latter case, yes it is yet another HAProxy-based solution. While we're here, a big thank you to Joao Morais for the great quality of the project. It has been much more pleasant to work with than the de-facto official Kubernetes one, ingress-nginx (not to be confused with NGINX Inc's one, nginx-ingress... but we will discuss the fun world of Kubernetes another time).
Once again, HAProxy shines by offering us the deep amount of observability we have come to expect from it.
After jumping through all of these hoops, you might wonder if we're finally there. And yes, we will now reach an instance of an application, which will handle the request and produce a response to it, which will work its way back to the end-user.
But, in some cases, we can still (and do) make use of further pre-processing, which is the topic of one last digression for today.
No one likes dead links
One of the design decisions we made early in MangaDex v5 development was to migrate our entity identifiers from integers to Universally Unique Identifiers (UUIDs). That is titles, users, groups, chapters, you name it.
But we do not want to invalidate multiple years of links scattered across the Internet. So we must efficiently, reliably, and transparently handle them. Perhaps forever. Ideally while keeping track of this process over time.
Turns out, there are only so many ways to do all of this, and while we ended up relying on the kind people at redirection.io in great part, we will take a look at what brought us here.
Serving mappings through the API
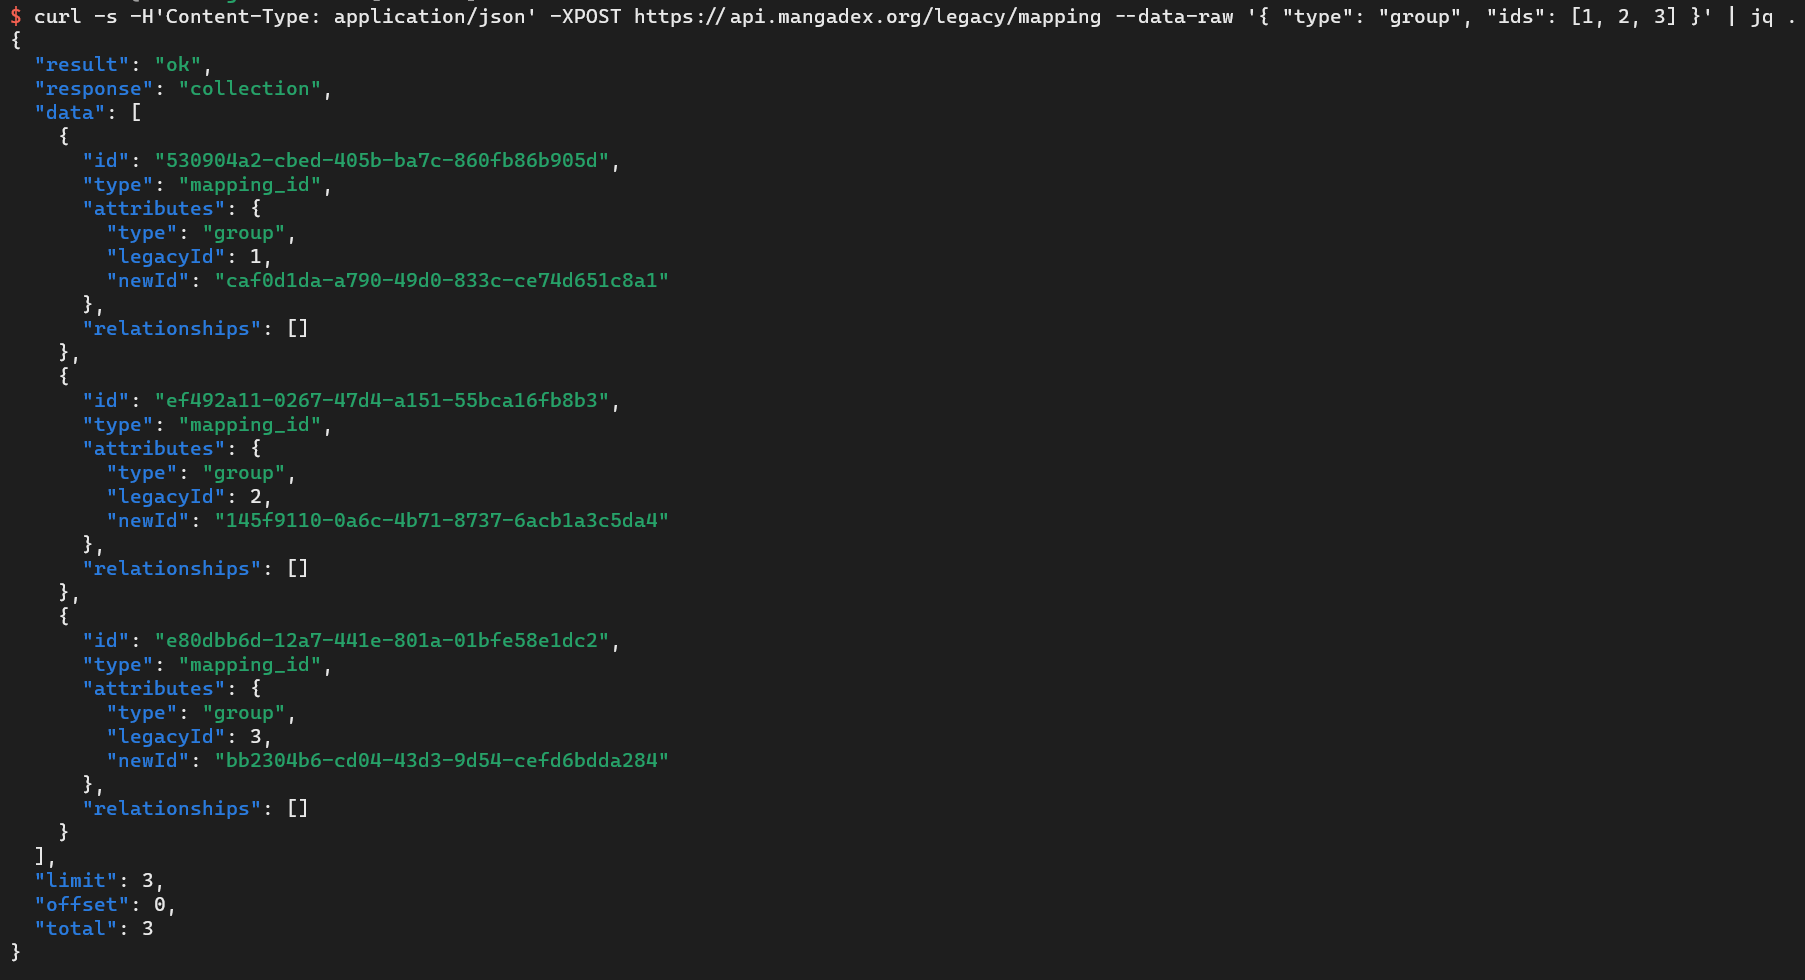
One way to handle legacy identifiers is to have your web frontend detect the old ID format, issue an API call to get the equivalent new ID, and automatically redirect users. We can achieve that through relatively simple means (to develop and later use), like our legacy mapping API route. And to an extent, we do rely on this ourselves too.
However, it is not quite an ideal solution either.
For users, relying on extra API requests merely slows things down on rare occasions; for our backend, however, it is additional work with limited day-to-day value and lookups for invalid identifiers tend to get noisy in high-level metrics. This was particularly problematic as we had only limited caching capacity at the beginning of V5 when this mechanism was most needed.
In the end, while it is something we do keep around for reliability reasons (i.e.: if other solutions fail us), it is intended merely as a fallback.
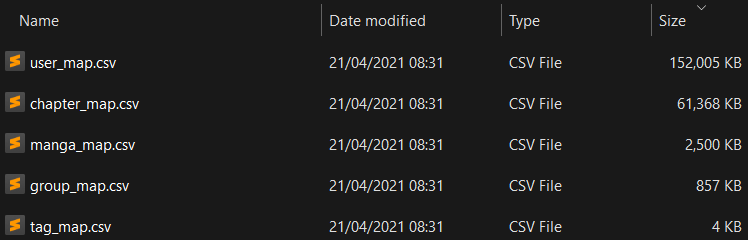
Static file mappings
Another option is hardcoding all the mappings in something like an nginx map. The result is a couple of lengthy configuration snippets. They subsequently get loaded into memory during the web server startup process and can be referred to via typical nginx directives. This works but has some noticeable drawbacks.
Let us put aside the observability limits and the difficulty of doing anything fancier than simple redirects within nginx for now. With this approach, you also suddenly have hundreds of megabytes to funnel as part of your nginx configuration. This is slow and a recipe for future trouble.
Assuming you still go this route, you need to pick where they live. You might first be tempted to push them at the edge, but that would be wasting valuable memory that could be used for more caching capacity. You do not really want it on your internal load balancer either as those are truly critical pieces of infrastructure, so the simpler their configuration the better, and megabytes of mappings doesn't quite register as "simple and foolproof".
In the end, they simply fit most naturally at the same level as your applications.
Externalised dynamic mappings
At this point, you are pretty much already treating the whole process as a first-class application in its own right. Maybe the right approach is to take the next step and truly commit to this.
By this, we mean developing a proper internal service for this very purpose. Then you can even build progressive updates into the mix, have fancy matching rules and finely-tuned handling of each link. Maybe also add dedicated and extensive monitoring into the mix. The only downside at this point is the development and maintenance cost of such a system.
Thankfully, we met the people at redirection.io, who did build an entire platform specifically for this problem space, and they generously agreed to help us with it.
We have relied on them from the very reopening of MangaDex, and have had a total of 0 issues with redirects ever since, so we can say it's been quite a pleasure using their service.
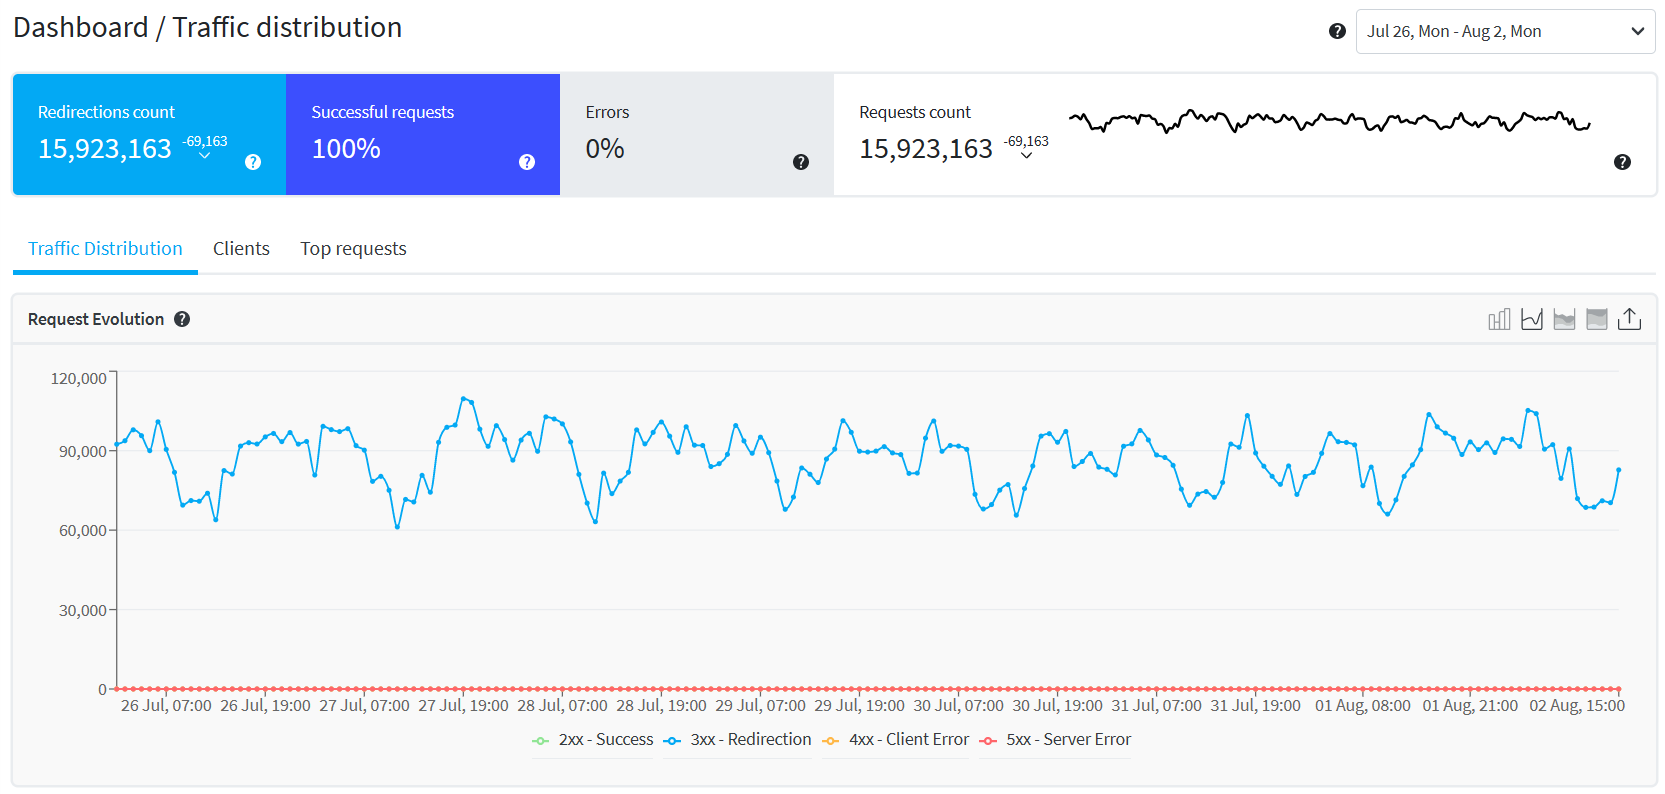
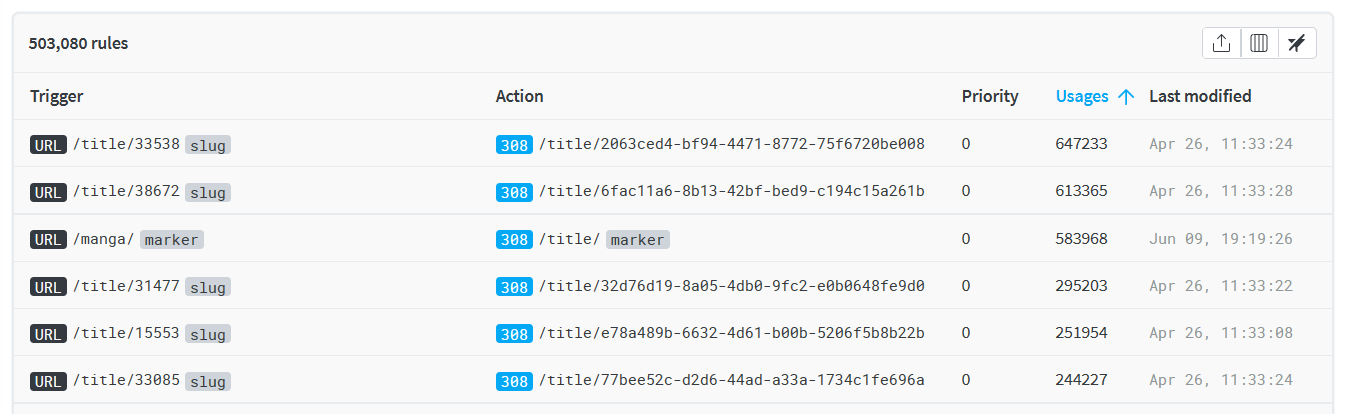
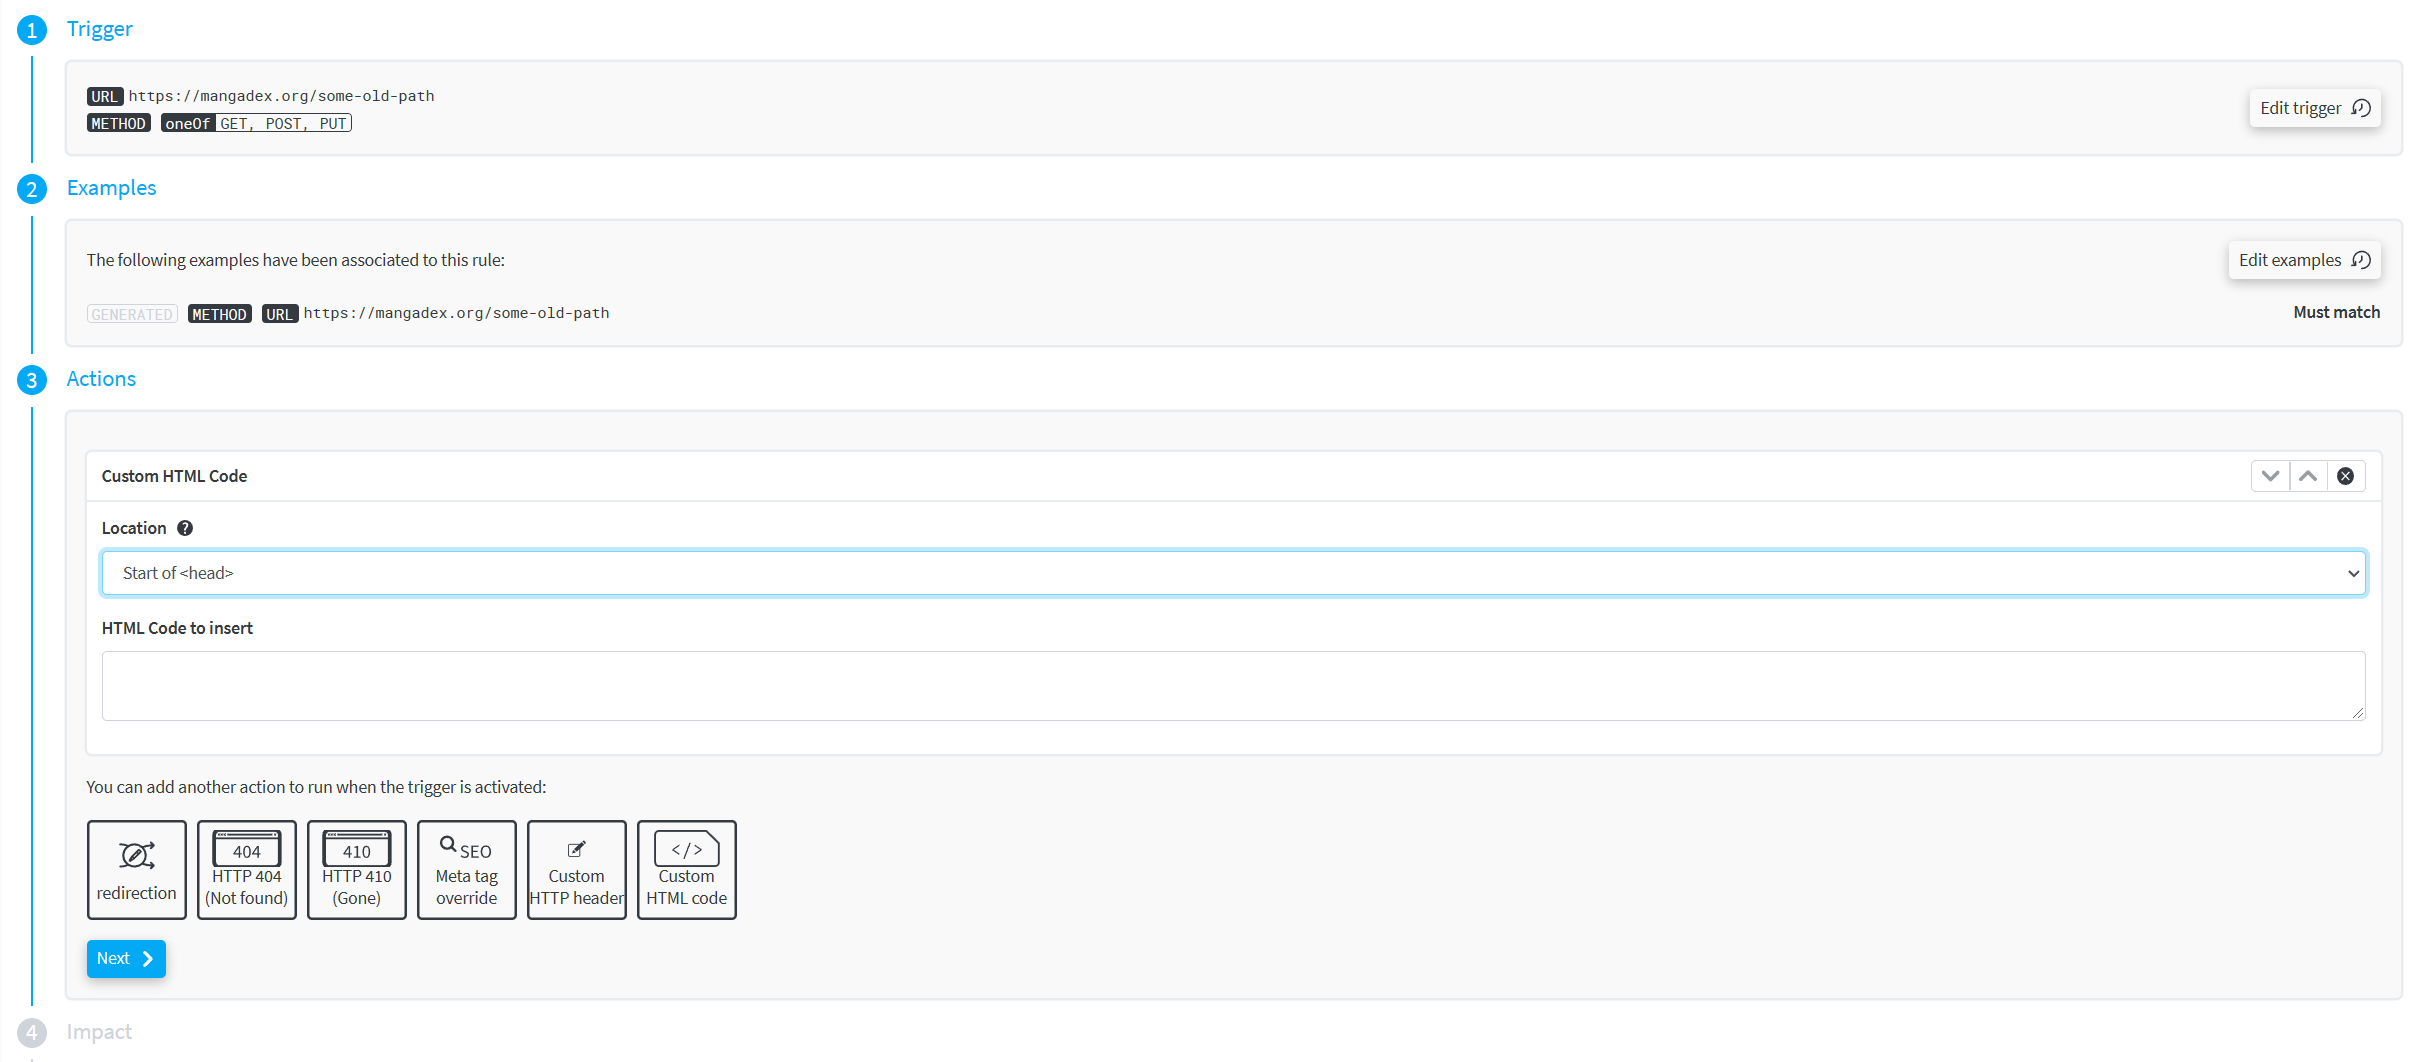
While we simply issue permanent redirects and thus do not need to make heavy use of complex rules, they do support some other much fancier behaviours too.
Finally, they also provide a good amount of details on an individual rule/request basis, which has been a very appreciable benefit to understand how and where these links are most used.
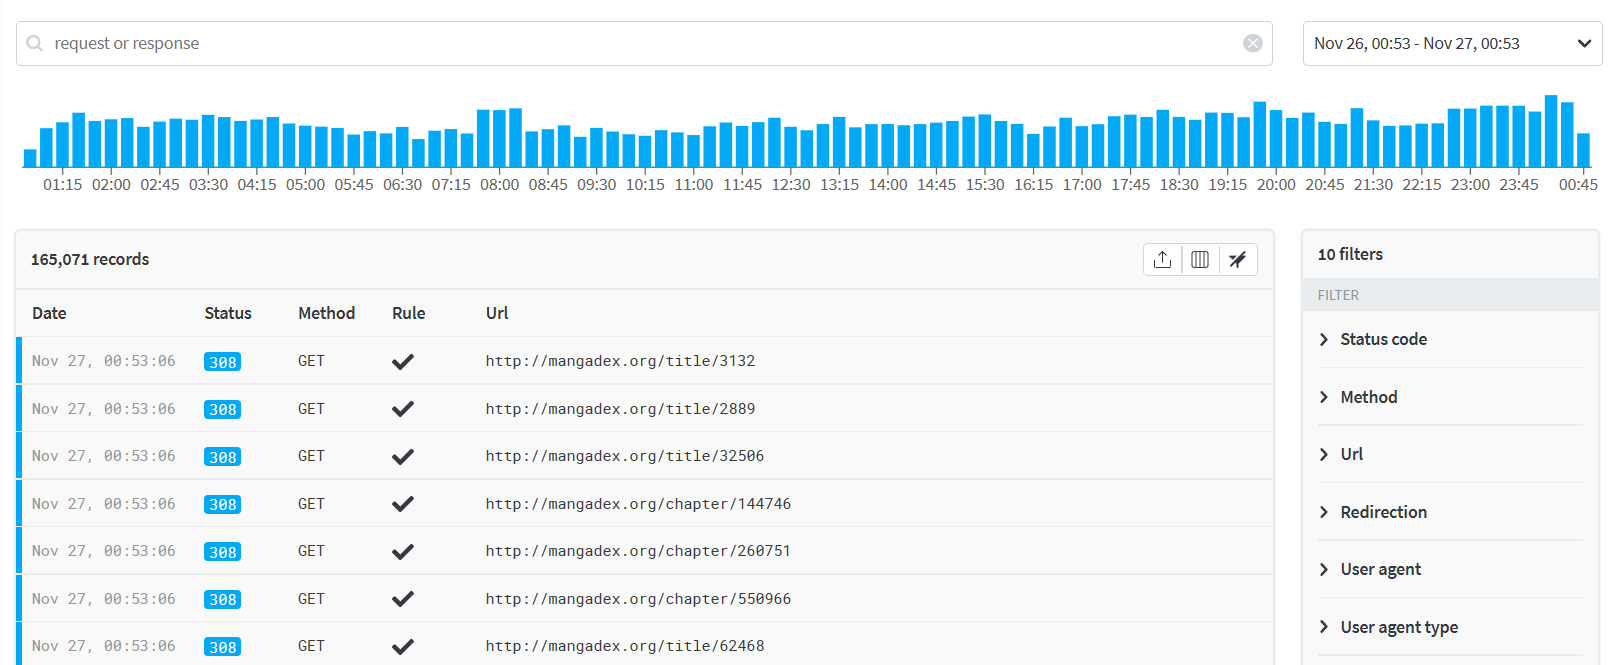
While we do not do it for privacy reasons, if one wishes to do so, their agent-based architecture could also very reasonably be used as a lightweight monitoring platform for your requests in general, as well as to dynamically push deployment-less behaviour changes (think maintenance pages for example).
$ curl [...] https://mangadex.org/title/47 [...]

GET /title/47
< HTTP/2 308
< [...]
< x-redirectionio-ruleids: 65a5b45d-9ccb-4893-87a9-dc09a9ac6b99
< location: /title/f9c33607-9180-4ba6-b85c-e4b5faee7192GET

GET /title/f9c33607-9180-4ba6-b85c-e4b5faee7192
< HTTP/2 200
< [...]
Overall we just want to thank them for the quality of their service, their help and guidance on the matter, and recommend for you to check them out if you're facing a similar challenge (or just curious).
Parting thoughts
This was another rather lengthy entry, and it took quite some time since the last one. We hope you still enjoyed the read and found some interesting takeaways for yourself.
We are always hard at work12 trying to make MangaDex as good as we can, which ends up leaving only limited time for writing these entries.
Look forward to more in the future, have a great day, and see you on MangaDex!